Efficient Money Use – April 2024
Foreword
Dan Olley, CEO Hargreaves Lansdown
The last five years have been hugely turbulent with both a global pandemic and subsequent cost of living crisis impacting on household finances. It’s no wonder then, that people have focussed more on immediate priorities rather than longer term planning when it comes to their finances. Our research shows that just 1 in 7 households are considered to have an adequate pension for a comfortable retirement.
But, there is light at the end of the tunnel. Even with these challenges, over 12 million households of working age do have the ability to significantly increase their resilience without having to increase their income - simply by changing how they manage their existing situation.
That’s a large group of people that need help to make the most of their financial future. Hargreaves Lansdown is on a mission to do exactly that: making it easy for people to save and invest for a better future. It’s why I was so excited to join the business.
As the latest data shows, education and understanding is vital. Just starting that journey of awareness of how some subtle changes can make a big difference. These latest findings show that the more financially literate a household, the more likely they are to be balancing the short and long term trade-offs by investing to make more of their money.
As a nation, the cost of not getting this right is significant. The consequences will be felt by society at large, not just individuals if we aren’t planning for the future. Those who can make their money work harder for them will finish work with larger retirement savings, boosting not only their spending power but also shoring up the future of their family. Ensuring society will still have a generation of spenders in retirement will provide a continued boost to the wider economy. A key part of this planning is about managing social care costs – something the next Government needs to tackle to free up people’s wealth for productive use.
With over 40 years’ experience in helping people in this mission, HL is uniquely placed to help individuals, and the UK as a whole, on that journey to greater resilience.
As a country, we’re on the cusp of a revolution in how people will be able to access help with their finances. Improvements in technology, data analysis and changes to how regulators enable financial firms to provide help, with the review of the advice / guidance boundary, will together allow people to truly take responsibility for their financial future.
Since we started this collaboration with Oxford Economics, we’ve seen the nation’s finances flourish in some areas but there continues to be worrying shortfalls in others. I am delighted that this particular report takes our established, holistic approach to measuring financial resilience and explores the extent to which households can improve their financial resilience.
The partnership HL have developed with Oxford Economics to measure the nation’s financial resilience is vitally important, as it shines an unparallelled light on which parts of society are thriving and who are most at risk; examining the trade-offs between short and long term financial resilience. It also shows the role we can all play – from individuals, to industry, policymakers and regulators – in increasing Britain’s financial resilience.
As always, we are grateful to our Sounding Board for delivering challenge and their expert perspectives. The group now comprises representatives from Nationwide, Swiss Re, Blackrock, Great Western Credit Union, The Building Resilient Households Group, MaPS, Resolution Foundation, Step Change, Nest Insight, DWP, FCA, and HM Treasury. In addition, Professor Sharon Collard from the Personal Finance Research Centre provides her insight along with consumer advocates Johnny Timpson and Faith Reynolds.
Executive summary
The combination of lockdown and then the cost-of-living crisis have impacted on household financial resilience significantly, although not evenly across society. This is most evident in short term resilience, where the Rainy Day Savings pillar in the barometer has performed particularly well over this period driven by an accumulation of assets over the pandemic. The proportion of households with adequate cash based savings, an indicator in this pillar, increased from 46.1% to 63.1% since 2019. This is despite the cost-of-living crisis having seen some erosion of savings.
This growth in the level of cash savings prompted this report to take a deeper look at how these spare savings could be used to improve financial resilience. The work has three key findings:
Over 12 million households have the ability to improve their long-term resilience by investing or contributing to a pension. One solution to boosting long-term resilience could be in improving information and knowledge on the subject as those with higher financial literacy are more likely to invest.
A handful of households are in arrears with debt or bills but are investing. It is unclear as to the order to which these households got into difficulty, but shows the importance of thinking of financial resilience more broadly.
Homeowners with children are particularly exposed to passing away due to adequate life cover, with the average yearly cost to plug this shortfall standing at £320.80.
The households with excess savings and no investments
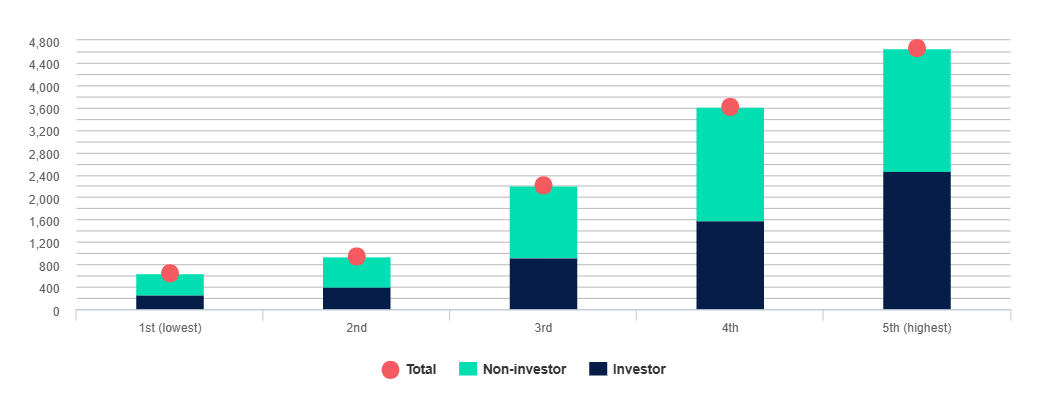
There are 12.1 million households that aren’t in arrears and have enough savings, who are in a position to build for the future, yet less than half (46.8%) of them are currently investing. Households in the highest earning quintile (with incomes over £77,400) are most likely to be investors, but still only around half (53.0%) are currently investing. Part of the picture could be familiarity with investments, because those households with better financial literacy are more likely to be investors (49.5%) than those with poor financial literacy (30.0%).
Fig. 1. The proportion of those with more than enough savings who are investing – and those who aren’t *1
Number of households not in arrears with excess cash based savings split by those investing and not investing, thousands, 2023 Q4
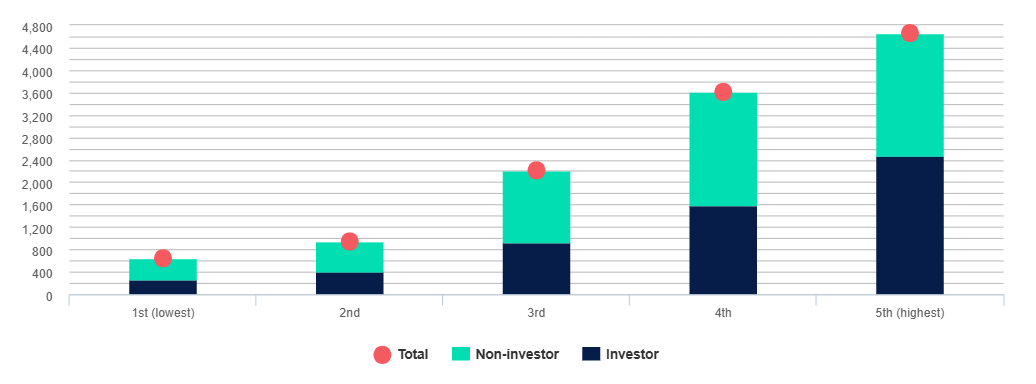
Source: Oxford Economics
If those with more than enough savings and no investments were to start investing it would boost the overall barometer score by 0.7 points.
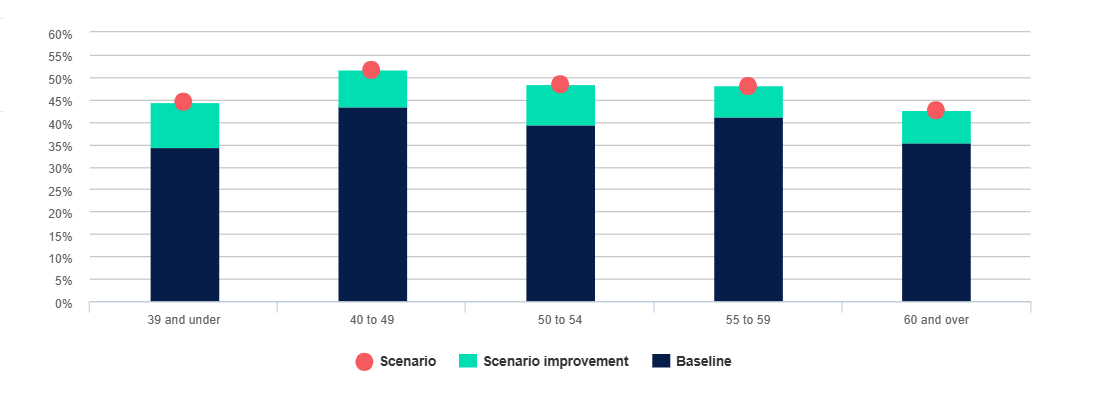
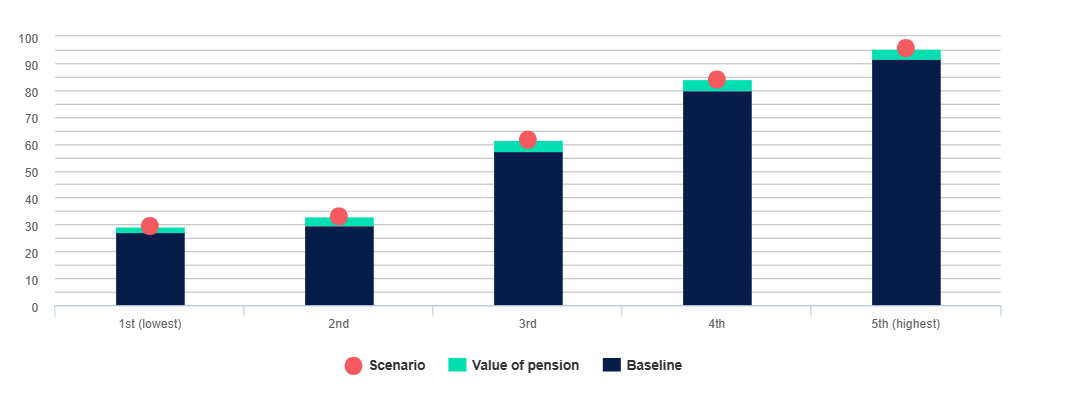
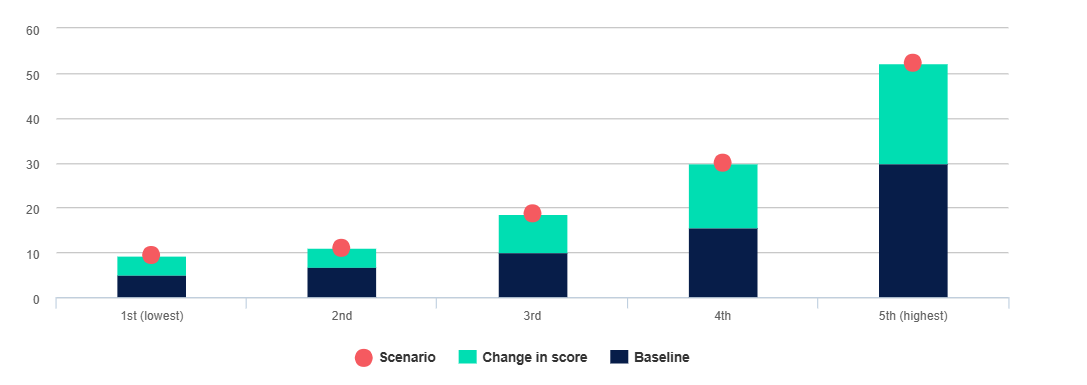
These households could also use their excess cash based savings and potentially their investments to improve their pension adequacy. The Barometer shows that 12.2 million households don’t have enough pension savings for a moderate living standard. Within this group, 6.9 million households are not in arrears and have more than enough savings and investments that could be used to boost their pension provision. If those households were to transfer these assets to their pension, it would increase the proportion of households with adequate pension savings by 8.9ppts, representing 1.8 million households. The is greatest for those aged 39 and under, partially because they need less in their pension pot in order to be on track.
Fig. 2. Pension resilience can be improved by households putting excess savings into their pensions*2
Change in the overall proportion of households meeting adequacy in pension value, 2023 Q4
Source: Oxford Economics
Households in arrears and investing
There are 1.8 million households in arrears across the nation, they also tend to score badly for surplus income and assets, so overall for this group, reallocating their money won’t be the answer to paying their debts.
Fig. 3. A relatively large proportion of younger households*3 4
Proportion of in-arrears households that are still investors by cohort, 2023 Q4
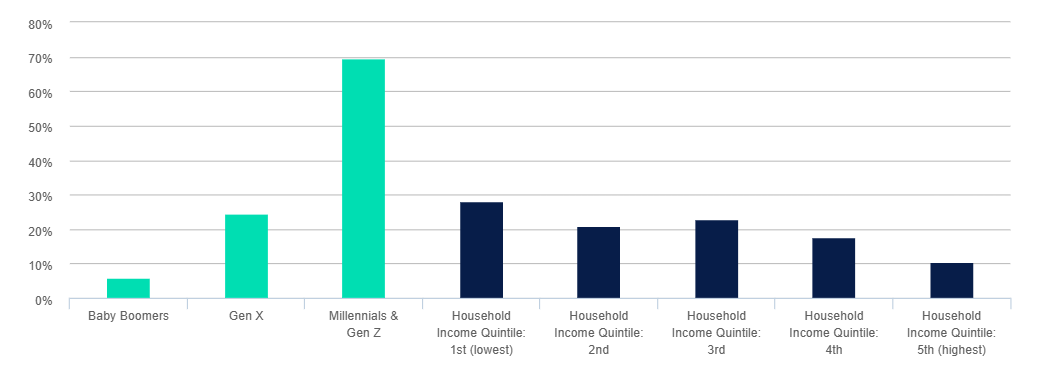
Source: Oxford Economics
Those households not in arrears can build their cash based savings by saving their surplus income, switching from investments to savings or cutting consumption. However, for many households, it is not possible to save enough in the near future from their surplus income without cutting consumption. It will take the average household in the lowest income quintile nearly four years to build up an adequate level of cash based savings from surplus income alone.
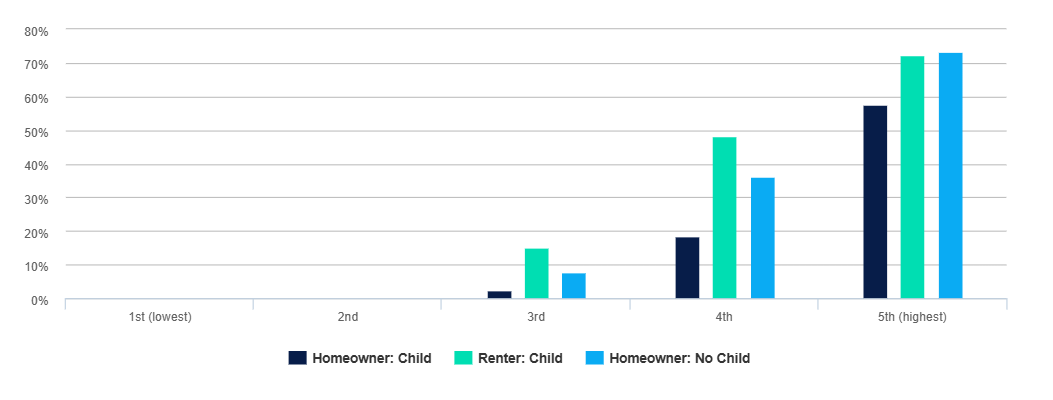
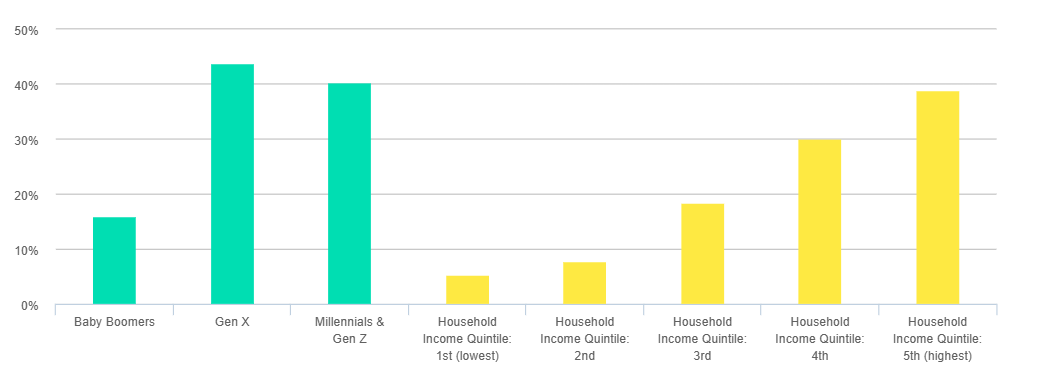
However, the Barometer shows that 15.8% of households in arrears are currently investing, so could improve their near-term resilience. These households tend to be younger and on lower incomes. The proportion of Millennial and Gen Z households in this position (69.5%) stands in stark contrast compared to the proportion of Baby Boomers (5.9%).
Households with dependants
There are 14 million households with a dependant*5 across Great Britain. Assets can also protect dependants from a catastrophic shock, but over half (56.6%) of all households with dependants have greater liabilities than the combined value of their assets and life insurance. Homeowners with children perform particularly poorly in the insurance indicator scoring 58.2 compared to the national average of 76.0.
Fig. 4. Homeowners and those with children have a lower adequacy of life insurance score*6
Adequacy of life insurance indicator score, 0-100, pre-pandemic, Proportion of those meeting adequacy in life insurance, pre-pandemic
Source: Oxford Economics
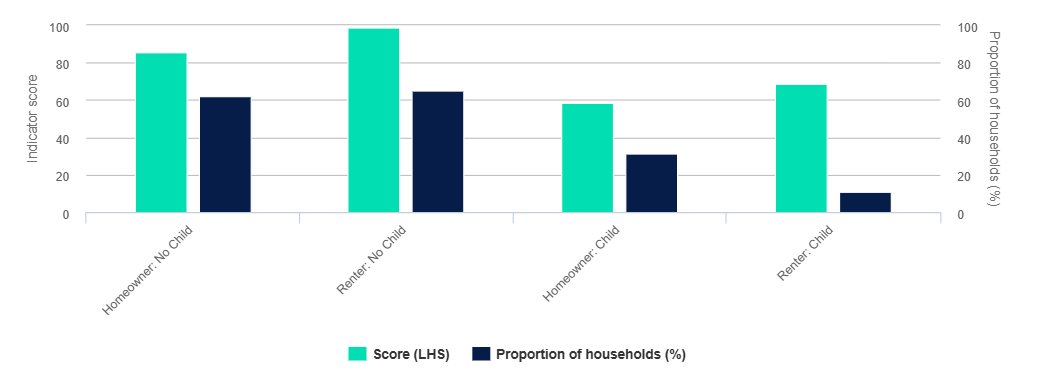
The median life insurance adequacy gap for households with dependants is £89,800, but rises significantly to £194,200 for homeowners with children. The average annual cost of closing the adequacy gap is estimated to be £133.80 but is substantially larger for homeowners with children at £320.80.
Fig. 5. The median cost to achieve life insurance adequacy for homeowners and renters with and without children
Median annual cost, 2023 Q4
Source: Oxford Economics
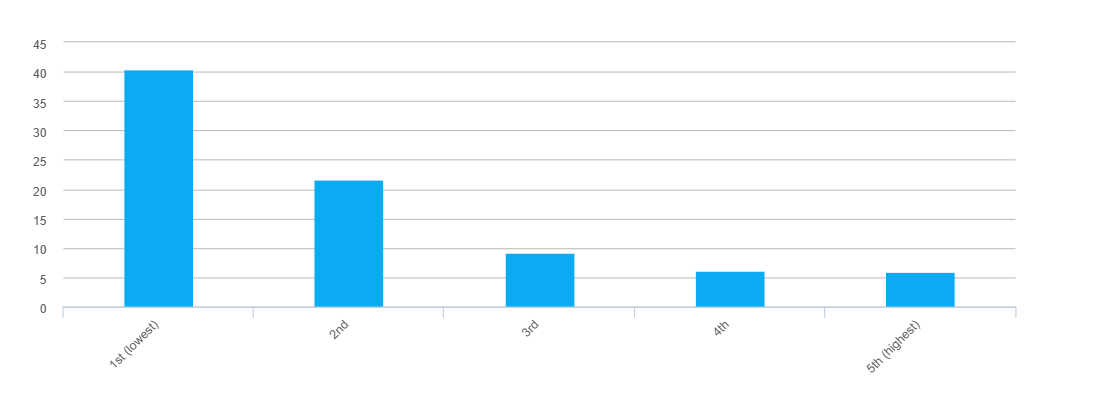
There are 2.4 million households not in arrears who can afford to close their life insurance gap and still have enough surplus income. However, it’s mainly higher earners, with 77.7% of these households sitting in the upper two income quintiles. There are no households in the bottom two income quintiles who can close this gap and still have robust surplus income. Across the income quintiles, homeowners with children are less able to close their life insurance gap while still having enough surplus income.
Fig. 6. Proportion of households who can pay to close their life insurance adequacy gap and still have a surplus income score of 100 by income quintile and household type *7
Proportion with sufficient ability to save after paying for life insurance and not in arrears, 2023 Q4
Source: Oxford Economics
Introduction
The Savings and Resilience Barometer provides a holistic measure of the financial resilience of households across Great Britain. The Barometer’s unique design allows this report to explore where households may be making sub-optimal financial decisions and how changes in behaviour can boost their financial resilience.
The analysis in this report was motivated by the variation seen across the Barometer’s five pillars since 2019. The improvement in Rainy Day Savings (10.5 points) and Invest (1.6 points) scores shows there has been an accumulation of assets over this period. The Barometer shows that the proportion of households with an adequate level of cash based savings assets has increased by 16.2 percentage points since 2019 to 63.1% in 2023 Q4. In contrast, the weaker performance in the Plan for Later Life and Protect Your Family pillars over this period suggests there may be scope for simple behavioural changes to boost households’ financial resilience. This report explores the potential impact of several changes in financial decision making.
Fig. 7. The uneven performance across the pillars suggests the scope for households to improve their financial resilience through simple behavioural changes
Change in Barometer score, 2023 Q4 vs 2019
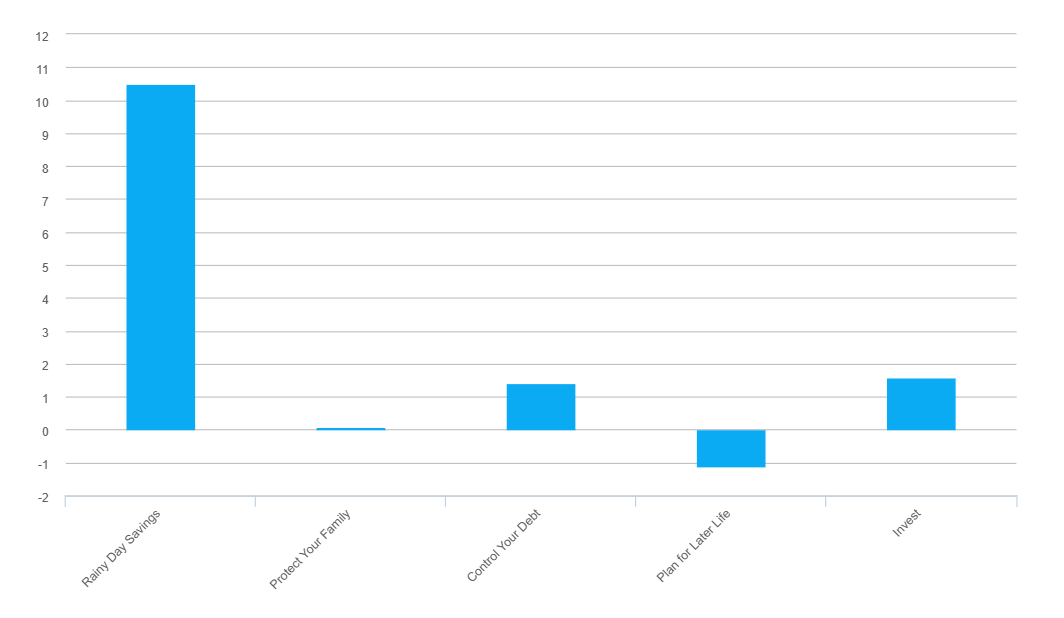
Source: Oxford Economics
Section Two identifies the households with the least scope to improve their financial resilience, those in arrears with less than three months of cash based savings. It then assesses the scope for households in this position to use surplus income and investment savings to improve their near-term financial resilience.
Households that are not in arrears and have sufficient cash based savings to protect against a rainy day are more likely to be able to improve their financial future through changes in financial decision making.
Section Three analyses these households and assesses the potential impact of reallocating their excess cash based and investment savings on the Barometer’s net financial assets and pension value indicators.
Section Four identifies households that are more likely to have a life insurance gap (liabilities that exceed the value of their assets and life insurance cover). It then examines the extent to which different household types can close this gap by drawing on surplus income.
Households in arrears and unprepared for a rainy day
Overview
There is limited scope for households in arrears and with less than three months of cash based savings to improve their resilience through improved financial management. This section identifies household cohorts that are more likely to be living under these circumstances. It then assesses the scope for those in this group who have surplus income or investment savings to improve their near-term financial resilience.
Arrears
The government’s support packages were broadly effective in mitigating the impact of the surge in households’ energy bills and inflation now stands at 3.2%, well below its recent peak of 11.1%. However, the pandemic and the protracted cost-of-living crisis have created significant financial challenges for households. This can be seen in the deterioration of the in arrears indicator which is down by 1.7 points since 2019. This deterioration has not been spread evenly with households who are not working (-9.2) and those in the lowest income quintile (-6.2) seeing the larger falls in their scores.
Fig. 8. In recent years a larger proportion of households have gone into arrears
Change in the in-arrears indicator score, 2023 Q4 vs 2019
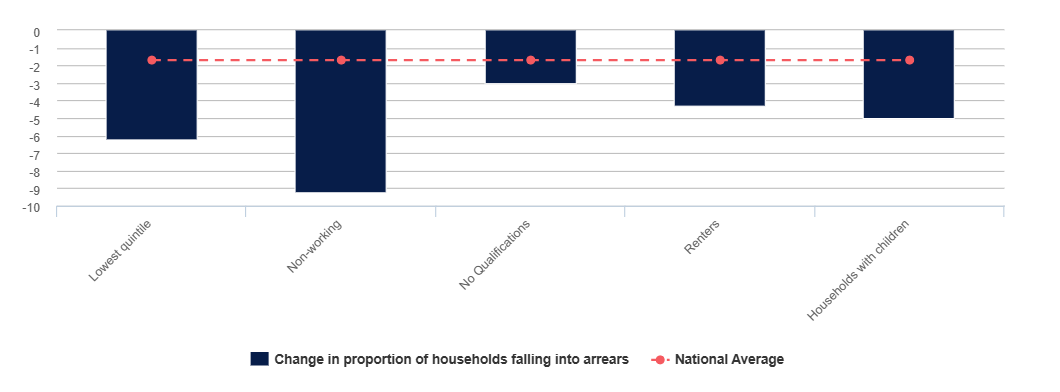
Source: Oxford Economics
Those in arrears tend to score poorly in other indicators
Households can use surplus income and existing assets to catch up on their debt payments. However, the Barometer shows that this will be challenging for households in arrears as this group scores poorly across the indicators linked to surplus income and assets. There are 1.8 million households in this position, of which 50% are employed, 7% are self-employed, and 43% are unemployed. The unemployed within this group are particularly likely to struggle to get out of arrears due to their limited income.
The surplus income score for households in arrears is 23.5 points lower than the corresponding score for households not in arrears. The median monthly surplus income for a household in arrears is £30, substantially below the £300 for those not in arrears. There is also a substantial gap between these two groups across each of the asset-related indicators.
Fig. 9. Households in arrears tend to score poorly across other indicators
Indicator scores of households in arrears, 0-100, 2023 Q4
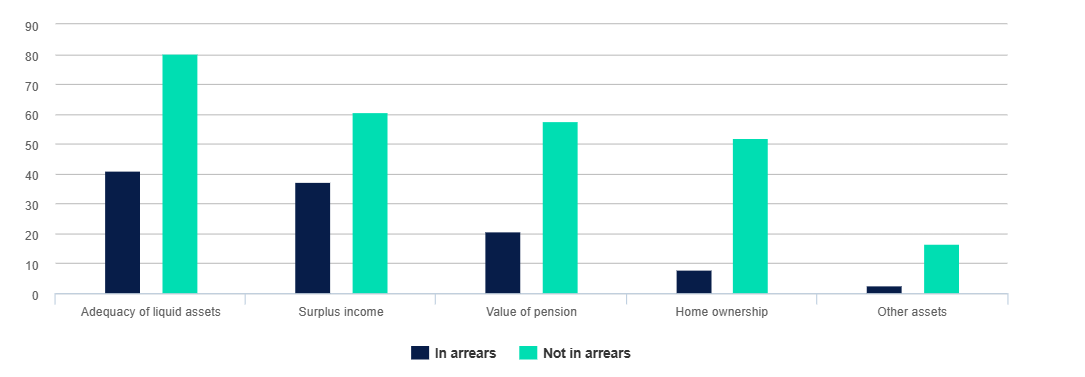
Source: Oxford Economics
However, some households in arrears are simultaneously investing and could reallocate these funds to improve their immediate financial position
The Barometer shows that 15.8% of households in arrears are currently investing. This behaviour is more common in younger households where 69.5% of Millennial and Gen Z households in this position are simultaneously investing. This stands in stark contrast to the 5.9% of Baby Boomer households in arrears that are investing. The likelihood of households in arrears simultaneously investing also increases as income decreases. In the bottom income quintile, 28.0% of households in arrears are investing, while the corresponding figure for the top income quintile is only 10.5%. This suggests that for younger and poorer households in arrears, there are significant opportunities to improve their immediate financial position by reallocating invested funds.
It's important to note that households in arrears may have either chosen to invest or may have become investors and subsequently fallen into arrears. Since the dataset cannot distinguish between these scenarios, further research in this area could be beneficial to understand the behavioural biases that are shaping these decisions and what can be done to encourage more holistic planning.
Fig. 10. A relatively large proportion of younger households and lower-income households that are in arrears are still investing*9
Proportion of in arrears households that are still investors by cohort, 2023 Q4
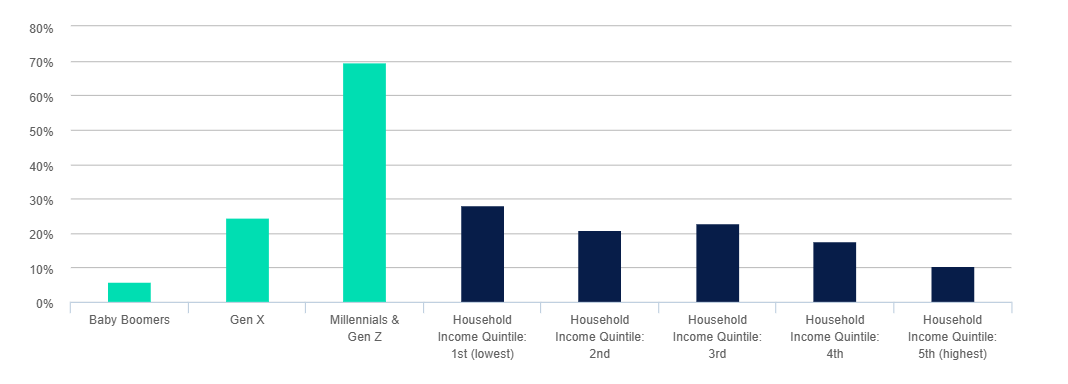
Source: Oxford Economics
Insufficiently prepared for a rainy day
The adequacy of liquid assets indicator assesses a household’s ability to weather a financial shock by comparing their cash based savings to three months of essential spending. This indicator improved substantially during the pandemic as households’ spending was curtailed by restrictions. The cost-of-living crisis has reversed some of these gains, but the score remains above its pre-pandemic level. Despite the improvement relative to the pre-pandemic period, 36.9% of households have inadequate cash based savings to cover three months of essential spending, representing 7.3 million households. Of these households, 5.8 million are not in arrears.
Fig. 11. The adequacy of liquid assets scores remains above its pre-pandemic level
% of households with more than three months of essential spending
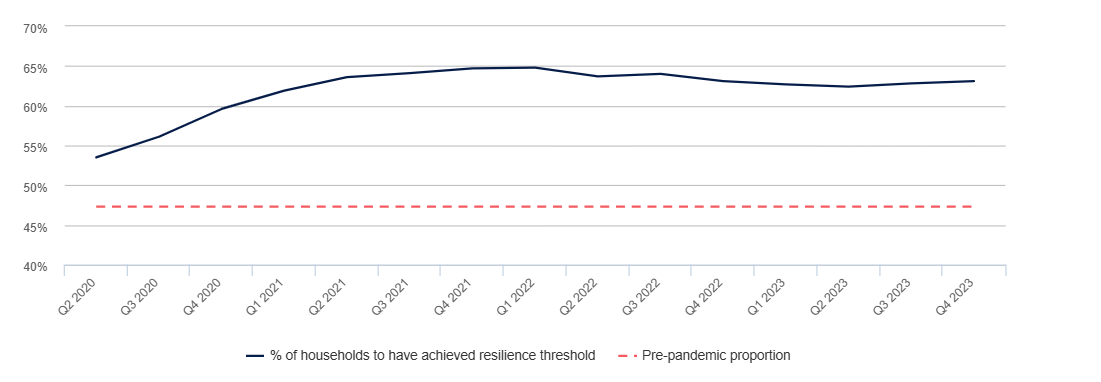
Source: Oxford Economics
Those with inadequate levels of cash based savings have limited options to improve their scores without reducing their consumption
Households with inadequate levels of cash based savings who are not in arrears can use surplus income and existing assets to improve their resilience against a financial shock. However, as with households in arrears, the Barometer shows that this will be challenging for households in this position to do without reducing their consumption. The surplus income score for households with inadequate cash based savings is 43.0 points lower than the corresponding score for households with adequate cash based savings. There is also a substantial gap between these groups across the indicators linked to planning for later life.
Fig. 12. Households with cash based savings that cover less than three months of essential spending score poorly across other indicators
Index scores of households with inadequate cash based savings and not in arrears, 2023 Q4
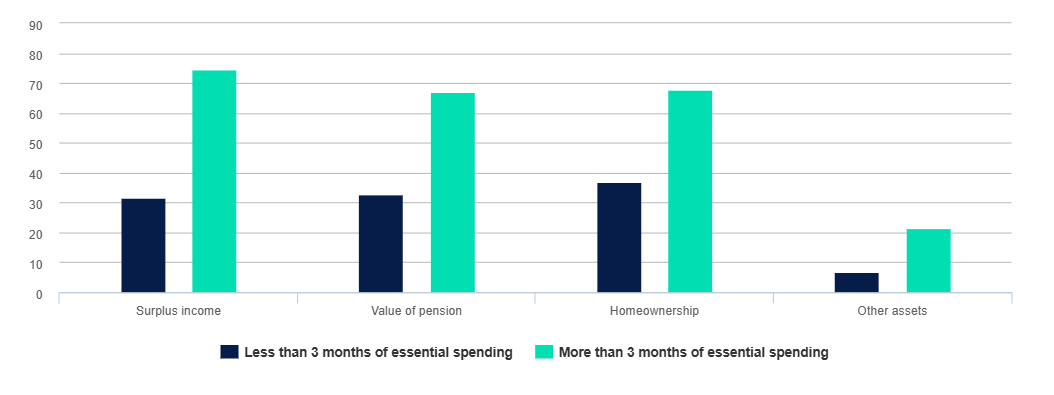
Source: Oxford Economics
Low surplus income makes it difficult for these households to build a sufficient level of cash based savings for a rainy day without reducing their consumption
Households that build up their cash based savings adequacy by saving surplus income will benefit from not having to incur costs associated with accessing investments or facing falls in their consumption. However, for many houses achieving adequacy in this way is not possible in the near term. For the average household in the second income quintile who are not in arrears, it will take nearly two years to build up an adequate level of cash based savings using surplus income, and for the average household in the bottom quintile not in arrears, it will take over three years.
Fig. 13. For poorer households not in arrears it will take years to build up a sufficient level of cash based savings using surplus income
Median months of saved surplus income required to achieve adequacy of cash based savings, 2023 Q4
Source: Oxford Economics
There are, however, some households that are insufficiently prepared for a rainy day and are investing
Households can increase their cash based savings by selling their investments. This can improve their resilience to adverse financial shocks, but households should balance this benefit against potential costs that may result from exceeding their capital gains tax allowance or having to sell in an adverse environment. In addition, emergency savings will naturally wax and wane as they are drawn upon in times of need, so it is reasonable for these to be replenished with surplus income over time.
There are 1.6 million households not in arrears with inadequate cash based savings that are still investing. If all households in this position were to reallocate their investment savings, this would increase the proportion of households in this group with adequate cash based savings by 710,000 or 3.6ppt. The increase in households achieving adequacy is greater for higher income households. Even after this change, the proportion of lower income households below the adequacy threshold remains high.
Fig. 14. Poorer households still face a gap even after investment savings are moved to cash based savings
Proportion of those meeting adequacy in the liquid assets indicator, 2023 Q4
Source: Oxford Economics
Improving plan for later life indicators
Overview
Households that are not in arrears and have sufficient cash based savings to protect against a rainy day can use their excess cash based savings to build for a better financial future. Households in this position that also have investment savings may have a further opportunity to improve their financial future by reallocating these assets. This section identifies households in this position and assesses the potential impact of reallocating their assets on the Barometer’s net financial assets and pension value indicators.
Using excess cash savings to invest
There are 12.1 million households that are not in arrears and hold more than three months of cash based savings. These households have excess funds to invest and are primarily higher earners. Those earning over £49,800, who represent the upper two income quintiles, account for over two-thirds of this group. Holders of excess cash based savings also tend to be young to middle-aged with 84.0% of this group coming from Gen X, Millennial, and Gen Z households.
Fig. 15. Higher income households represent a large proportion of those with excess funds to invest*11
Proportion of households not in arrears with excess cash based savings to invest by cohort, 2023 Q4
Source: Oxford Economics
Less than half of households with excess cash based savings are investing
Under half (46.8%) of the 12.1 million households, who have excess cash based savings and are not in arrears, are currently investors. The remaining 53.2% of this group are missing out on the opportunity to build a better financial future. Among this group, those in the highest earning quintile (with incomes over £77,400) are most likely to already be investors. However, even within this group only just over half (53.0%) are currently investing.
Fig. 16. Higher income households that are not in arrears and have excess cash based savings to invest are more likely to already be investing
Number of households not in arrears with excess cash based savings by income quintile, thousands, 2023 Q4
Source: Oxford Economics
The Barometer shows that reallocating excess cash based savings held by these households into financial assets improves the overall barometer score by 0.7 points and boosts the net financial asset indicator by 12.3 points. The improvement in score is higher for wealthier households reflecting the higher proportion of households reallocating their excess cash based savings and their possession of greater amounts of these savings. Indeed, the highest quintile seeing the largest boost (22.4 points) and the second quintile seeing the smallest gain (4.1 points).
Fig. 17. Higher income households see the largest improvement in financial assets scores
Change in whole population net financial assets indicator score by quintile, 2023 Q4
Source: Oxford Economics
Among the 12.1 million households who are not in arrears and hold excess cash based savings, those with better financial literacy are more likely to be investors. In this group, 49.5% of households that correctly answered both financial literacy questions in the Wealth and Asset Survey were investors compared to only 30% of households in this group who answered both questions incorrectly . Those who have a parent who is or was self-employed were more likely to be investors (49.1%) than those who did not have a self-employed parent (46.3%). As discussed in the self-employment report , this cohort is more likely to use non-pension sources to provide income upon retirement and suggests that this group learned these financial behaviours from the previous generation.
Using available funds to invest in your future
Households that are not in arrears can also use their excess cash based and investment savings to improve their pension adequacy. Investing in a pension can provide a more tax-efficient method for saving for retirement as you will be able to get tax relief on the contribution. Households will then be able to draw down 25% tax-free once they are 55 and potentially pay a lower tax rate when they make subsequent draw downs. This may be a particularly attractive option for older households who are actively thinking about their retirement.
The Barometer shows that 12.2 million households do not have the pension savings required to retire with a moderate living standard. Within this group, 57.0% of households have excess cash based and/or investment savings and are not in arrears that could be used to boost their pension score. The proportion of households in this position above 40 is relatively even, while this is lower for those under 40.
Fig. 18. There are many households that are not in arrears across the age distribution with the means to improve their pension scores through changes in financial decision making*14
Proportion of households not meeting adequacy in pension value, 2023 Q4
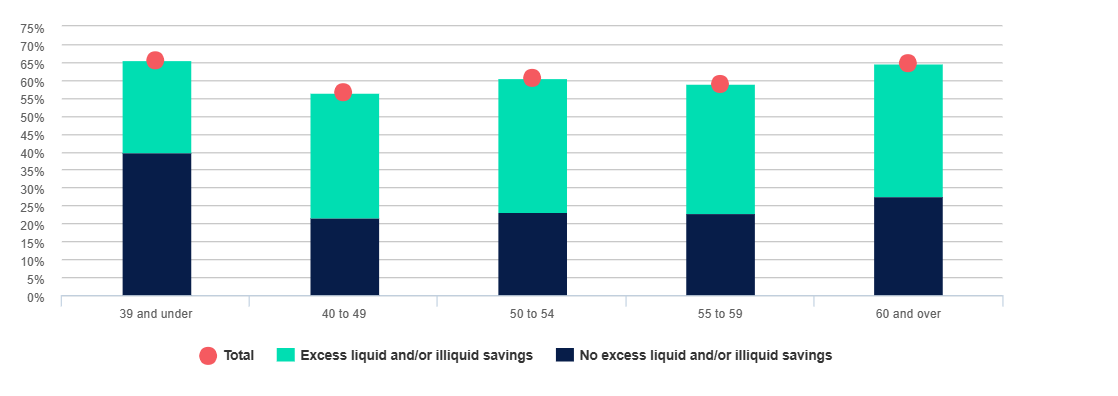
Source: Oxford Economics
If households that are not in arrears with excess cash based and investment savings were to transfer these assets to their pension, it would increase the overall proportion of households with adequate pension savings by 8.9ppts, representing 1.8 million households. The scenario would lead to a substantial increase in those reaching the threshold across all age brackets. The impact of this change in financial decision making on the indicator is greatest for those aged 39 and under, partially attributed to the comparatively lower threshold for pension values.
Fig. 19. Overall pension resilience can be improved by households putting excess savings into their pensions*15
Proportion of households meeting adequacy in pension value, 2023 Q4
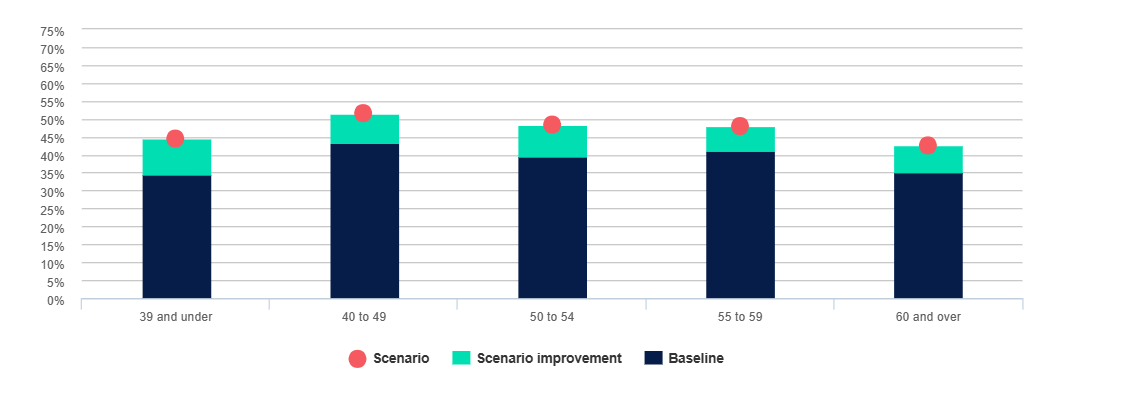
Source: Oxford Economics
Life insurance
Using excess cash based savings to purchase life insurance
The role of life insurance is to financially protect one’s dependants in the event of a catastrophic event. Households that have liabilities (including the cost of supporting a child to 18) that exceed the combined value of their life insurance cover and assets have a life insurance adequacy gap. Households with sufficient surplus income to close this gap can improve their financial resilience by using this income to purchase adequate life insurance coverage. This section examines life insurance adequacy across the nation and assesses which households are able to improve their financial resilience by closing this gap.
Households who own their own home and have children require more coverage
There are 14 million households with a dependant across Great Britain. Life insurance and assets provide a route to protect dependants from a catastrophic shock, but over half (56.6%) of all households with dependants have liabilities that are greater than the combined value of their assets and life insurance policy.
The adequacy of life insurance indicator score varies significantly across household types. Households with children score worse than households without children, this is because these households tend to insufficiently cover the additional cost of supporting a child to the age of 18. Homeowners also score worse in this indicator as the outstanding mortgage on their residence represents a liability not held by renters. Homeowners with children perform particularly poorly in this indicator scoring 58.2 compared to the national average of 76.0. Employees score slightly higher in this indicator (76.1) than those who are self-employed (74.1), as they often receive life insurance through their work.
Fig. 20. Homeowners and those with children have a lower adequacy of life insurance score*17
Adequacy of life insurance indicator score, 0-100, pre-pandemic, Proportion of those meeting adequacy in life insurance, pre-pandemic
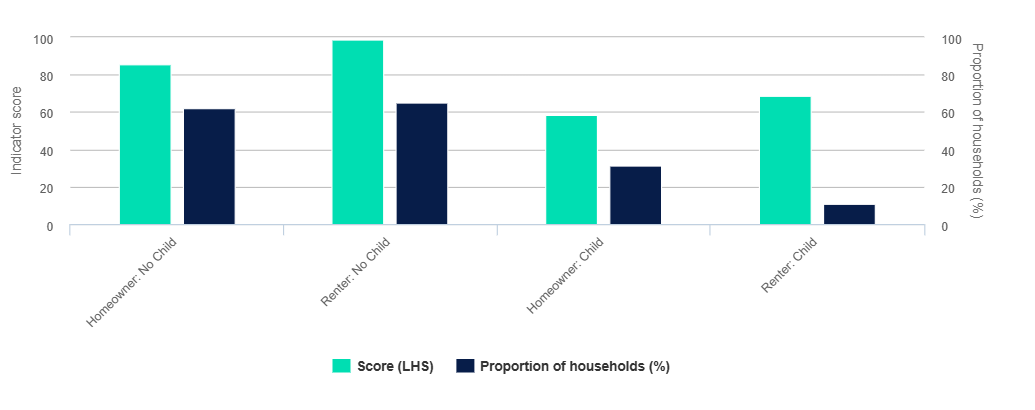
Source: Oxford Economics
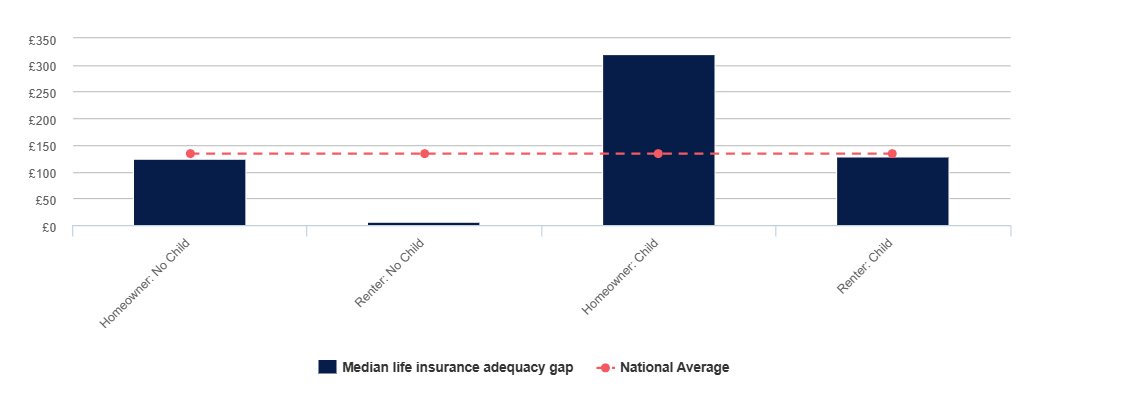
The median life insurance adequacy gap for households with dependants is £89,800. However, the gap varies significantly across household types. The gap for the median renter with no children is just £3,400, which stands in sharp contrast to the corresponding figure of £194,200 for homeowners with children.
Fig. 21. Homeowners with children have the largest life insurance adequacy gap
Median cost of closing the life insurance adequacy gap, thousand £
Source: Oxford Economics
The cost of closing the life insurance adequacy gap depends on one's age and the amount of coverage needed
The annual cost of life insurance coverage varies significantly with age. The average annual cost of £100,000 of life insurance coverage for a non-smoker in good health is estimated to start at £48.50 for a 20-year old and increase to £230.60 for a 50-year old.
Fig. 22. Average annual cost of a £100,000 life insurance coverage by age
Average annual cost, 2023
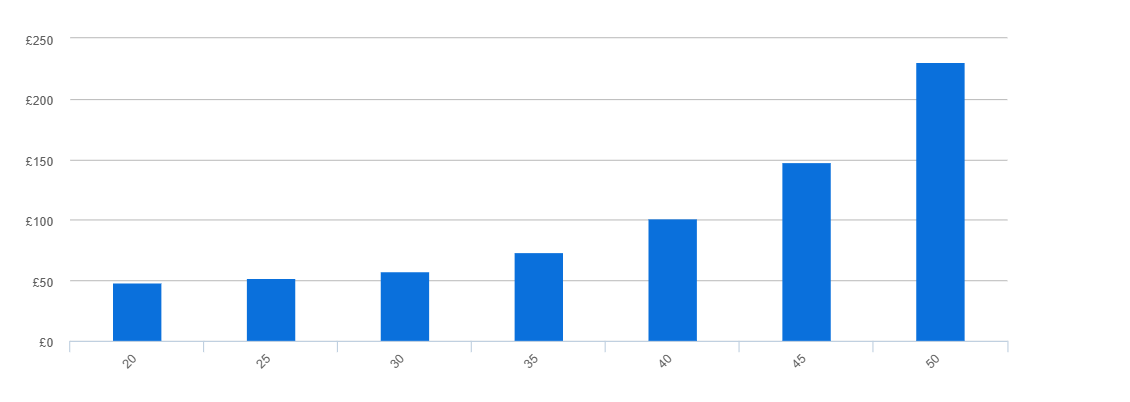
Source: Oxford Economics
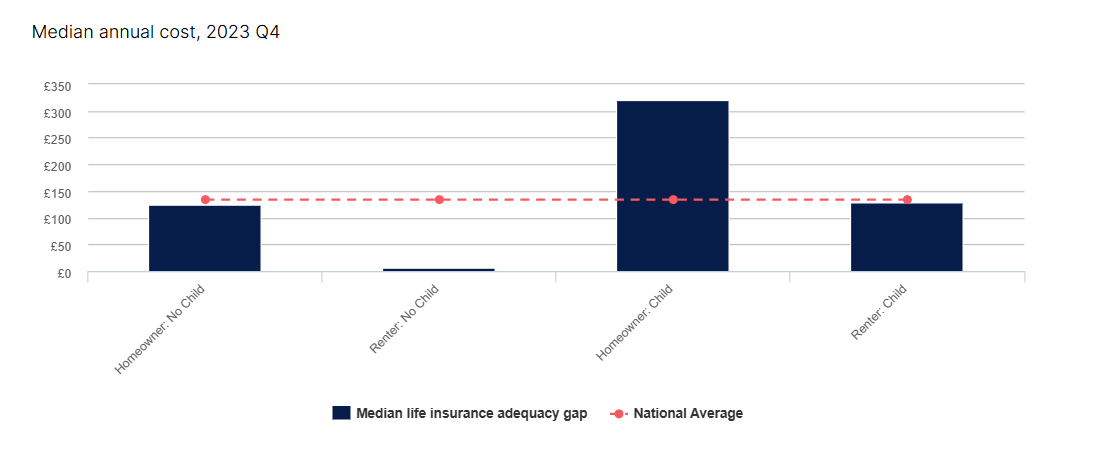
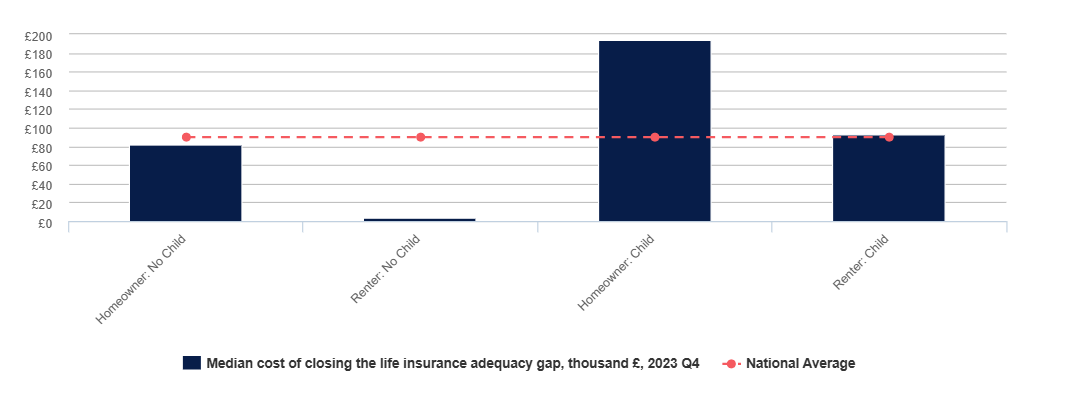
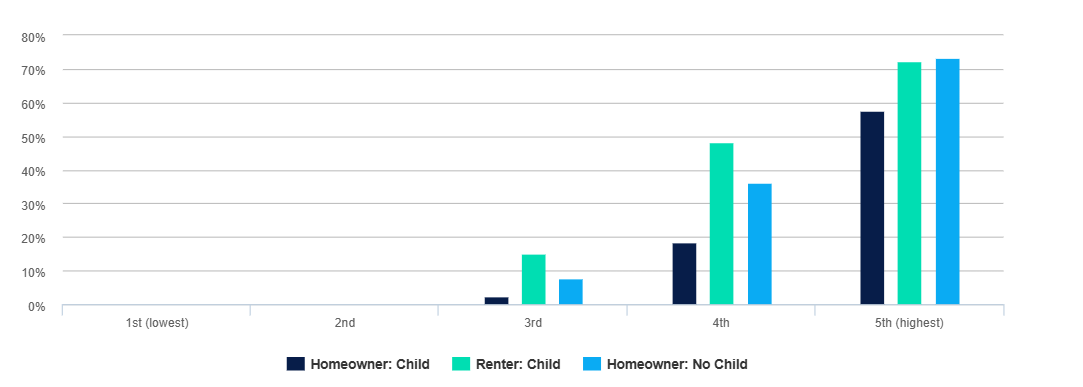
The annual cost of closing the life insurance adequacy gap depends on a household’s age and the size of their adequacy gap. The median annual cost is estimated to be £133.80. This figure is substantially higher for homeowners with children (£320.80), while there is almost no additional costs (£5.40) for renters without children.
Fig. 23. The median cost to achieve life insurance adequacy for homeowners and renters with and without children
Median annual cost to achieve life insurance adequacy, 2023 Q4
Source: Oxford Economics
Higher income households could afford to have better life insurance coverage
The additional cost of closing the life insurance adequacy gap will hit households’ surplus income. As the group that faces the largest additional cost, homeowners with children are most impacted by closing this gap and see a 4.6 point fall in their surplus income score. Despite the median cost of closing the gap for renters with children being substantially smaller, this group see their surplus income score fall by a similar amount (4.0 points). The similar score reflects the fact that a smaller proportion of renters are already achieving surplus income adequacy.
Fig. 24. Attaining life insurance adequacy results in the largest surplus income fall for homeowners with children
Change in surplus income score from additional life insurance costs, 2023 Q4
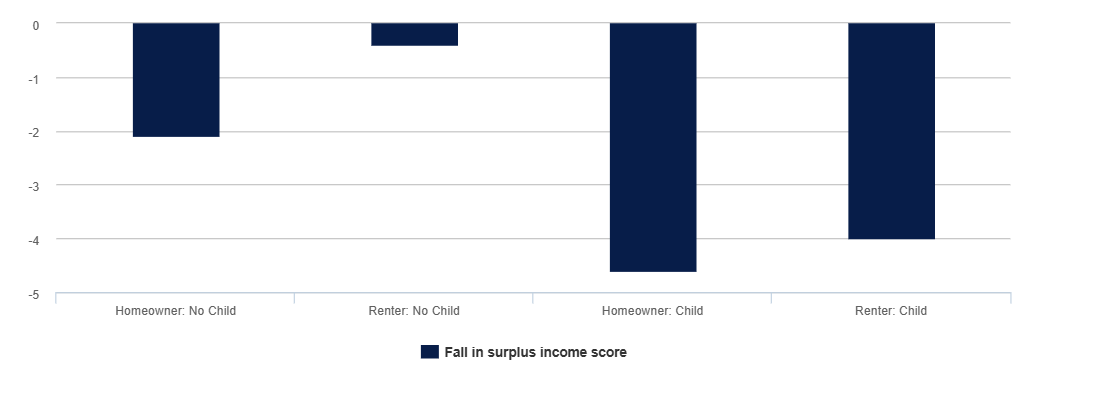
Source: Oxford Economics
There are 2.4 million households not in arrears who can afford to close their life insurance adequacy gap and still achieve adequacy in the surplus income indicator. However, this group is predominantly comprised of higher earners with 77.7% of these households sitting in the upper two income quintiles. There are no households in the bottom two income quintiles who can close this gap and still save, reflecting their low surplus income score and the size of the adequacy gap.
Fig. 25. Proportion of households who can close their life insurance adequacy gap and still have a surplus income score of 100 by income quintile and household type*19
Proportion with sufficient ability to save after paying for life insurance and not in arrears, 2023 Q4
Source: Oxford Economics
About the barometer
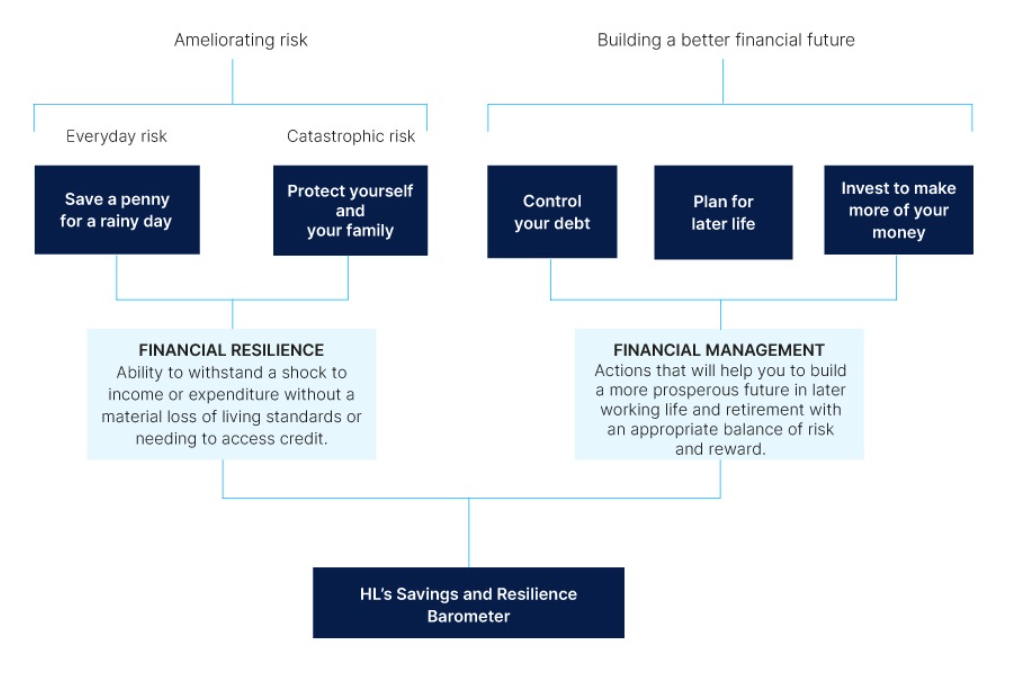
The savings and financial resilience barometer is an index measure designed and produced by Oxford Economics. It is based around Hargreaves Lansdown’s five building blocks for financial resilience depicted in Fig. 26. The aim of the barometer is to provide a holistic measure of the state of the nation’s finances, monitoring to what extent households are prudently balancing current and future demands whilst guarding against alternative types of risk.
Fig. 26. Savings and Resilience Barometer: conceptual structure
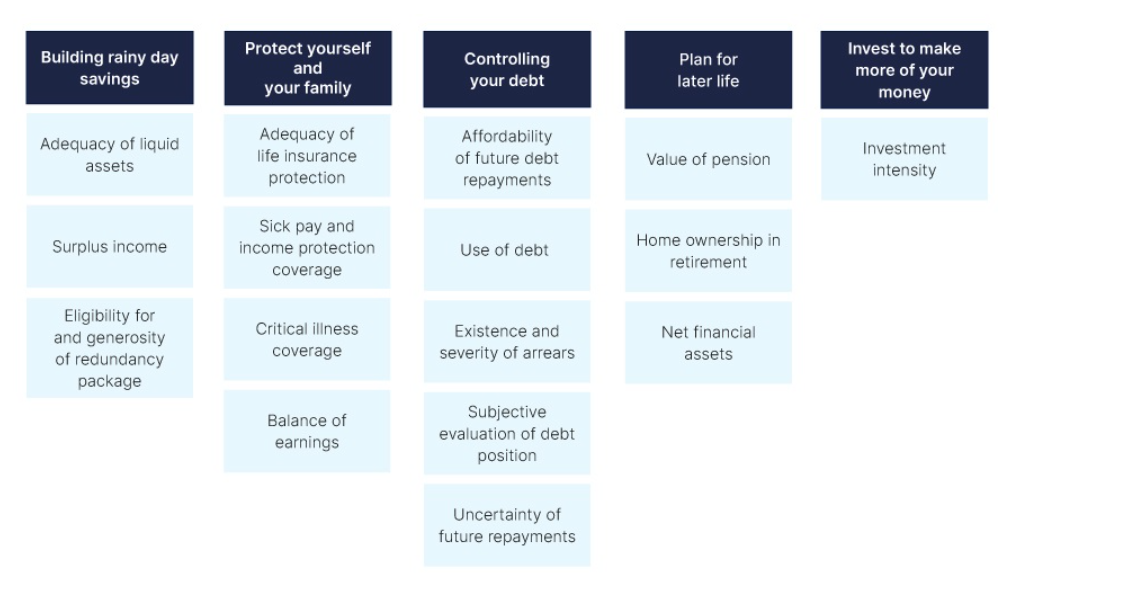
In collaboration with Hargreaves Lansdown, Oxford Economics mapped each of these pillars to a list of 16 individual indicators (Fig. 27). The data underpinning the indicators are sourced from a household panel dataset for a representative group of British households developed by linking together official datasets. The Wealth and Assets Survey (WAS), published by the ONS, has been used as the core dataset due to the breadth of financial data available in the survey. This source does not include every variable required to measure the factors and the latest survey only extends as far as 2020 Q1. Therefore, we have used a range of methods including econometric analysis to build upon the core dataset using data from the Financial Lives Survey (FLS), Living Costs and Food Survey (LCFS), and the Labour Force Survey (LFS).
For each indicator, the data were used to create an index value on a scale of between zero and 100 for households in the panel. In each case, a score of 100 was assigned to households who had reached a specified resilience threshold e.g., holding cash based savings equivalent to at least three months of essential expenditure. Households whose savings are sufficient to cover more than three months of spending are, therefore, not rewarded for this additional level of security. Such a design is appropriate to capture the concept of resilience and the intrinsic trade-offs involved in financial management. Threshold values are defined with reference to benchmark recommendations where available and, where not, using the statistical distribution of values within the dataset and the judgement of the research working group.
Fig. 27. Savings and Resilience Barometer: Barometer Indicators
To bring the dataset up to date, values have been extrapolated through to 2023 Q2 using a wide range of macroeconomic and survey data and different modelling techniques. A much more detailed description of the approach can be found in the methodology report available on the project’s landing page*14. Finally, current and future values are projected based on Oxford Economics’ baseline forecast for the UK economy from its Global Economic Model (GEM).
ABOUT OXFORD ECONOMICS
Oxford Economics was founded in 1981 as a commercial venture with Oxford University’s business college to provide economic forecasting and modelling to UK companies and financial institutions expanding abroad. Since then, we have become one of the world’s foremost independent global advisory firms, providing reports, forecasts and analytical tools on more than 200 countries, 100 industries, and 8,000 cities and regions. Our best-in-class global economic and industry models and analytical tools give us an unparalleled ability to forecast external market trends and assess their economic, social and business impact.
Headquartered in Oxford, England, with regional centres in New York, London, Frankfurt, and Singapore, Oxford Economics has offices across the globe in Belfast, Boston, Cape Town, Chicago, Dubai, Dublin, Hong Kong, Los Angeles, Mexico City, Milan, Paris, Philadelphia, Stockholm, Sydney, Tokyo, and Toronto. We employ 600 staff, including more than 350 professional economists, industry experts, and business editors—one of the largest teams of macroeconomists and thought leadership specialists. Our global team is highly skilled in a full range of research techniques and thought leadership capabilities from econometric modelling, scenario framing, and economic impact analysis to market surveys, case studies, expert panels, and web analytics.
Oxford Economics is a key adviser to corporate, financial and government decision-makers and thought leaders. Our worldwide client base now comprises over 2,000 international organisations, including leading multinational companies and financial institutions; key government bodies and trade associations; and top universities, consultancies, and think tanks.
April 2024
All data shown in tables and charts are Oxford Economics’ own data, except where otherwise stated and cited in footnotes, and are copyright © Oxford Economics Ltd.
The modelling and results presented here are based on information provided by third parties, upon which Oxford Economics has relied in producing its report and forecasts in good faith. Any subsequent revision or update of those data will affect the assessments and projections shown.
To discuss the report further please contact:
Henry Worthington :hworthington@oxfordeconomics.com
Oxford Economics
4 Millbank, London SW1P 3JA, UK
Tel: +44 203 910 8061
1 The quintile groupings - Quintile 1: less than £19,100, Quintile 2: £19,100 - £31,800, Quintile 3: £31,800 - £49,800, Quintile 4: £49,800 - £77,400, Quintile 5: more than or equal to £77,400 – reflect nationwide income quintiles rather than for those not in arrears with excess cash based savings.
2 Figures may not sum to totals due to rounding. The Barometer only includes non-retired households as those who are retired will be focusing on some different financial decisions.
3 The quintile groups are calculated based on Wave 6 of the Wealth and Asset Survey and updated to reflect average wage growth up to 2023. The quintile groupings - Quintile 1: less than £19,100, Quintile 2: £19,100 - £31,800, Quintile 3: £31,800 - £49,800, Quintile 4: £49,800 - £77,400, Quintile 5: more than or equal to £77,400 – reflect nationwide income quintiles rather than a quintile grouping for households in arrears.
4 With the Barometer only including non-retired households, the proportion of households that are baby boomers is smaller than Gen X and Millennials & Gen Z. Baby boomers comprise 14.7% of non-retired households, while Gen X constitutes 40.0%. Millennials and Gen Z combined represent the larger share, accounting for 45.3%.
5 Dependants include children or other adults in the households that may be financially impacted.
6 Due to data limitations on life insurance coverage, the life insurance indicator is not extrapolated. The data are therefore based on the coverage during Wave 7 of the Wealth and Asset Survey, 2018Q2-2020Q1.
7 The quintile groupings - Quintile 1: less than £19,100, Quintile 2: £19,100 - £31,800, Quintile 3: £31,800 - £49,800, Quintile 4: £49,800 - £77,400, Quintile 5: more than or equal to £77,400 – reflect nationwide income quintiles rather than for households with a life insurance adequacy gap.
8 The quintile groupings - Quintile 1: less than £19,100, Quintile 2: £19,100 - £31,800, Quintile 3: £31,800 - £49,800, Quintile 4: £49,800 - £77,400, Quintile 5: more than or equal to £77,400 – reflect nationwide income quintiles rather than for households in arrears.
9 With the Barometer only including non-retired households, the proportion of households that are baby boomers is smaller than Gen X and Millennials & Gen Z. Baby boomers comprise 14.7% of non-retired households, while Gen X constitutes 40.0%. Millennials and Gen Z combined represent the larger share, accounting for 45.3%.
10 The quintile groupings - Quintile 1: less than £19,100, Quintile 2: £19,100 - £31,800, Quintile 3: £31,800 - £49,800, Quintile 4: £49,800 - £77,400, Quintile 5: more than or equal to £77,400 – reflect nationwide income quintiles rather than for households with inadequate cash based savings.
11 The quintile groupings - Quintile 1: less than £19,100, Quintile 2: £19,100 - £31,800, Quintile 3: £31,800 - £49,800, Quintile 4: £49,800 - £77,400, Quintile 5: more than or equal to £77,400 – reflect nationwide income quintiles rather than for households not in arrears with excess cash based savings.
12 Question 1: If the inflation rate is 5% and the interest rate you get on your savings is 3%, will your savings have more, less or the same amount of buying power in a year’s time?
Question 2: Suppose you put £100 into a savings account with a guaranteed interest rate of 2% per year. You don’t make any further payments into this account, and you don’t withdraw any money. How much would be in the account at the end of the first year, once the interest payment is made?
13 https://www.hl.co.uk/features/5-to-thrive/savings-and-resilience-comparison-tool/self-employed-financial-resilience
14 Figures may not sum to totals due to rounding.
15 Figures may not sum to totals due to rounding.
16 Dependants include children or other adults in the households that may be financially impacted.
17 Due to data limitations on life insurance coverage, the life insurance indicator is not extrapolated. The data are therefore based on the coverage during Wave 7 of the Wealth and Asset Survey, 2018Q2-2020Q1.
18 Quotes are based on a non-smoker, in good health, for a level-term life insurance policy with a 20-year term and £100,000 of cover. Quotes shown are the average from Aviva, AIG, and Legal & General.
19 The quintile groupings - Quintile 1: less than £19,100, Quintile 2: £19,100 - £31,800, Quintile 3: £31,800 - £49,800, Quintile 4: £49,800 - £77,400, Quintile 5: more than or equal to £77,400 – reflect nationwide income quintiles rather than for households with inadequate life insurance coverage.
20 https://www.hl.co.uk/features/5-to-thrive/savings-and-resilience-comparison-tool