HL Savings & Resilience Barometer – January 2024
Foreword
Anne Fairweather, Head of Government Relations & Public Policy, Hargreaves Lansdown
Hargreaves Lansdown’s fifth Savings and Resilience Barometer demonstrates how the pandemic and the cost of living crisis have impacted households across Britain.
With a General Election this year and the cost of living still topping polls of people’s concerns we look under the surface to see which households are most impacted.
Interestingly this report details how resilience levels are still higher now than they were in 2019. The report then uses the barometer data to draw out a deeper understanding below that headline figure, demonstrating which groups have been hardest hit.
The more in depth look at the position of renters in this report shows that those renters who have children, are on the lowest incomes, are not working, are single or are baby boomers are all more vulnerable compared to other renters. Whilst mortgage holders are still being hit by the higher interest rates, our analysis shows that renters remain in a far worse position.
The barometer’s look into longer term impacts of today’s economic stresses makes for interesting reading, with higher income households facing a bigger hit on their later life planning. This reflects the reduction in value in housing assets as well as how inflation has made it harder to reach a moderate income in retirement.
Savings rates have provided the biggest variation in inputs to our barometer scores since 2019. As the economy stabilises further in 2024 we should all focus on ensuring that groups who have eroded their short-term savings are able to rebuild them.
Finally, we were able to update the ‘invest to make more of your money’ pillar with the latest data from the FCA’s Financial Lives Survey. This reflects the uptick we saw in investing during the pandemic. More concerningly it shows that younger people and those in lower income groups were more likely to have invested, when they often do not have sufficient rainy day savings.
Balancing out financial planning across the 5 pillars of our ‘5 to thrive’ is something which we will continue to focus on at HL over the years to come.
As ever we would like to thank the members of the sounding board for their reflections: HM Treasury, DWP, Money and Pensions Service, FCA, Nationwide, Resolution Foundation, Nest Insight and the Personal Finance Research Centre at the University of Bristol. In particular we’d like to thank Gareth Thomas for his help in accessing the latest data from the FCA’s Financial Lives Survey.
Executive summary
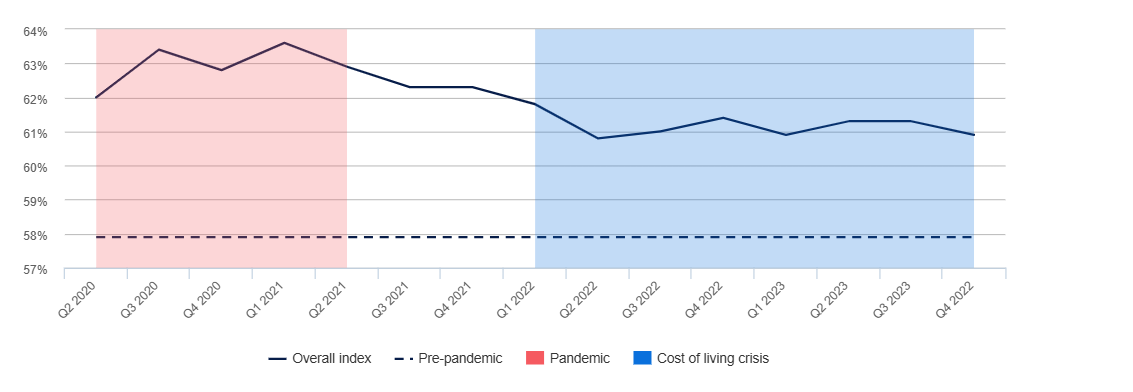
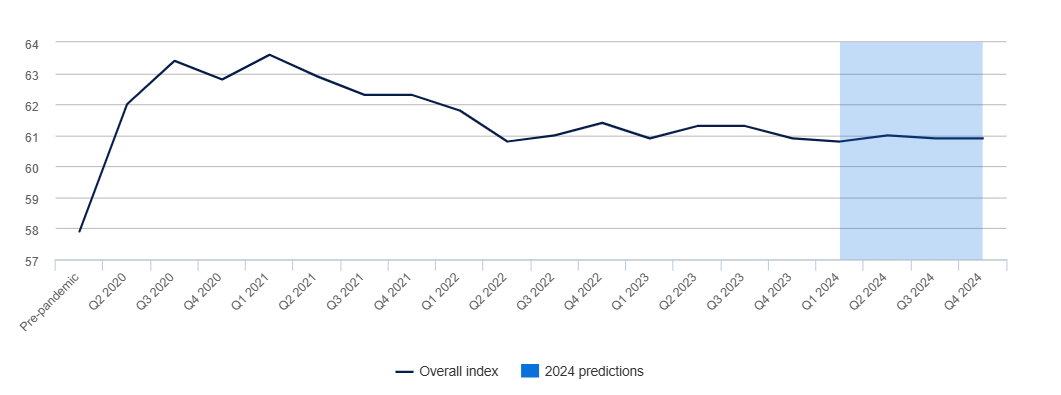
Household financial resilience continued to deteriorate in 2023, albeit at a slower rate than seen in 2022. The national average score dropped by 0.5 points to 60.9 (out of 100) in 2023. This means that since the onset of the cost of living crisis, around 30% of the gains realised over the pandemic have been wiped out. Despite this large cumulative fall over the duration of the cost of living crisis, driven by increases in interest rates and inflation, the average barometer score is still 3.0 points above pre-pandemic levels. However, this aggregate national picture hides important differences across the five pillars that make up the barometer and different socio-economic groups which this report will explore.
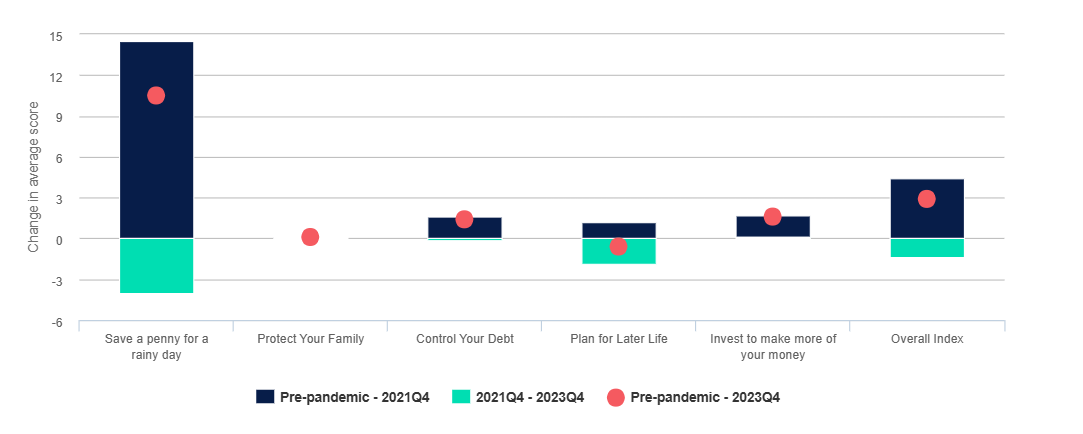
‘Save a penny for a rainy day’ pillar
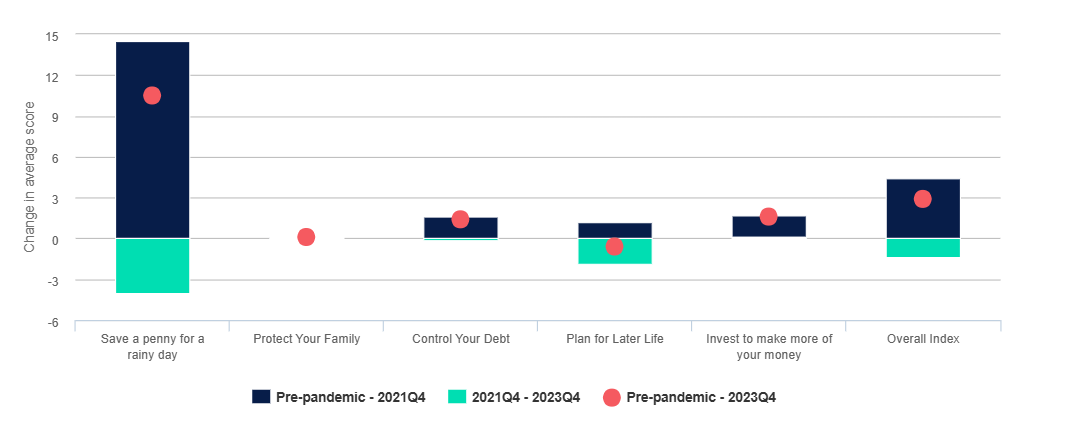
The significant improvement in the 'Save a penny for a rainy day’ pillar has driven most of the change in the barometer score over the past four years. Mirroring changes in the savings rate, the pillar’s score increased rapidly during the pandemic and these gains have only partially unwound over the cost of living crisis. This means that over this turbulent economic period saving has been prioritised and households, on average, are better prepared for unexpected emergencies than they were in 2019.
The changes seen in the other pillars have been more muted over this period. Growth in the ‘Invest to make more of your money’ pillar since the pandemic has been driven by an increase in the share of adults holding investment products from 32% to 37% between 2020 and 2022. This information, from the latest Financial Lives Survey*1, allows the Barometer to capture the impact of this important trend for the first time. In contrast, the ‘Plan for later life’ pillar has fallen since 2019 as recent falls in house prices have outweighed the gains realised over the pandemic period.
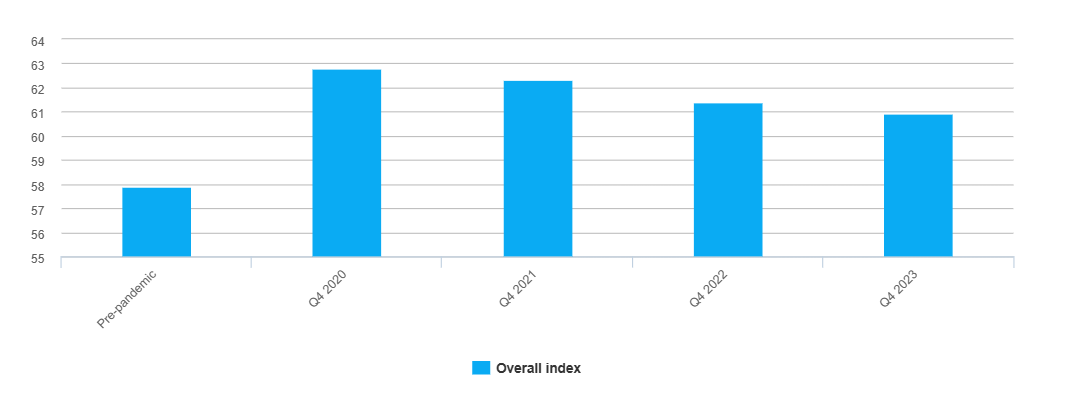
Fig. 1. The cost of living crisis has eroded some of the pandemic gains
Source: Oxford Economics
The headline score masks an alarming increase in inequality of financial resilience with the gap between the Barometer score for the lowest and highest income quintiles expanding
The gap between the lowest and highest income quintiles’ Barometer scores has grown by 4.5 points since 2019. Indeed, the highest quintile has experienced a notable rise in the proportion of households with 'good' or 'great' financial resilience, increasing from 76.9% in 2019 to 86.2% in 2023Q4. Conversely, the lowest quintile witnessed a fall in this proportion from 3.1% to 2.3%.
During the pandemic, lower income households were less able to save compared to wealthier households and benefitted less from growth in housing and financial markets. Already in a vulnerable position, low income households were then hit harder by the cost of living crisis as they spend a larger proportion of their budgets on items most hit by inflation, have fewer cheaper alternatives, and are less able to cut back on non-discretionary consumption. These challenges have contributed to a 3.0 point deterioration in the ‘Control your debt’ score for the lowest income quintile, which stands in sharp contrast to the 1.8 point improvement seen by the highest income quintile.
Fig. 2. Vulnerable households have either seen their financial resilience fall or underperform
Source: Oxford Economics
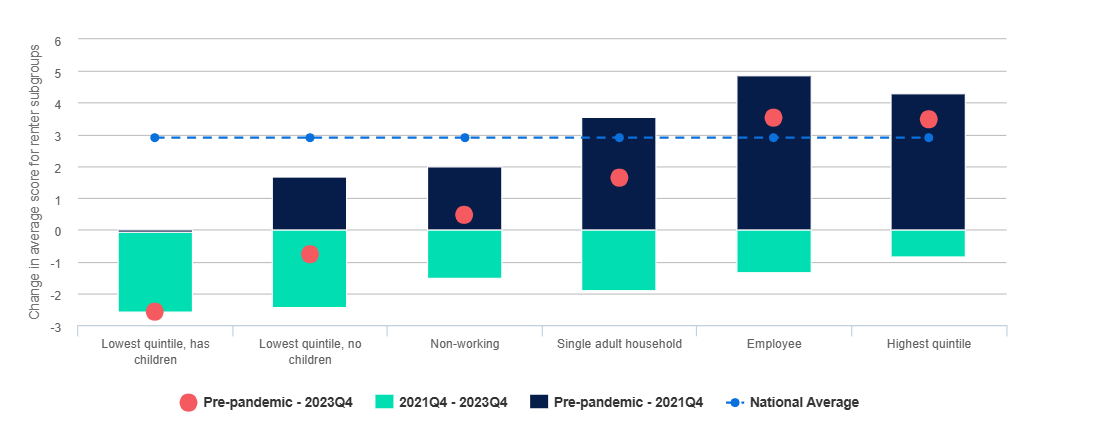
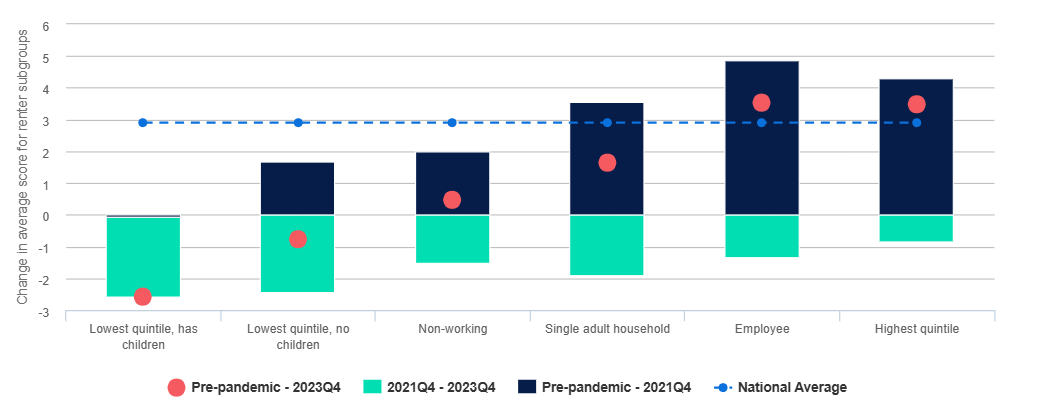
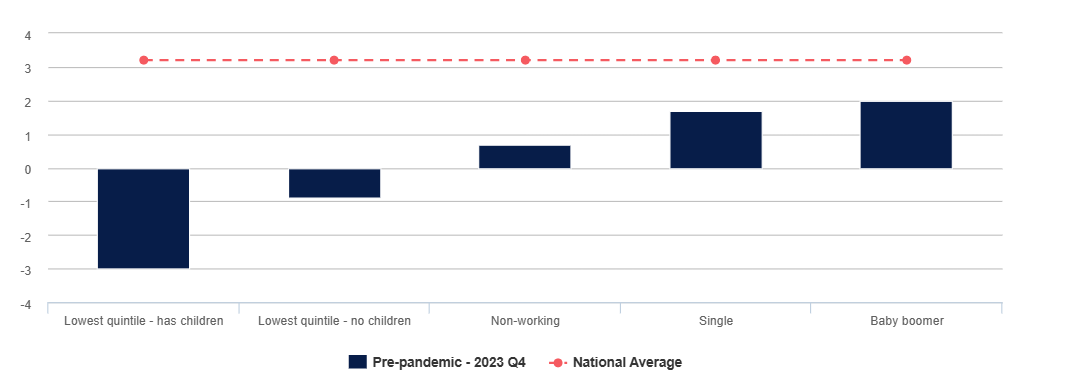
Households that rent typically have lower financial resilience and several of these renting cohorts have fallen further behind since 2019
Renters are far less financially resilient than homeowners, and over two-thirds of renters are categorised as having either ‘very poor’ or ‘poor’ financial resilience scores in 2023Q4*2. Within the Barometer, renters score particularly poorly in the ‘Plan for later life’ pillar underpinned by low scores in the home ownership indicator. Although on average renters’ financial resilience has improved since 2019, more vulnerable renters—such as those on low incomes or living on their own—have fared worse over this period. Renters in the lowest income quintile with children were particularly hard hit, experiencing large falls in their financial resilience.
Fig. 3. Renters with the lowest financial resilience also gained the least
Source: Oxford Economics
While the aggregate index is expected to stabilise in 2024, this masks changes at the pillar level
After several years of volatility, our forecast for the headline Barometer score is relatively stable over 2024, reflecting a more stable macroeconomic outlook. Having fallen by 1.4 points during the cost of living crisis, the score is expected to remain around 61.0 across 2024. This is driven by anticipated gains stemming from the recently announced cut to National Insurance contributions and declining inflation, being offset by a slowdown in pay increases and the fiscal drag, that elevates the tax burden on households. However, again, the headline score conceals a sizeable increase in the ‘Save a penny for a rainy day’ pillar that is caused by an expected increase in the savings rate. These gains are largely offset by a fall in the ‘Plan for later life’ pillar, which is primarily driven by a forecast 5.9% fall in house prices and asset prices failing to keep up with inflation.
Fig. 4. Household’s long-term financial resilience is expected to continue to fall in 2024
Source: Oxford Economics
Financial resilience – the current state of the nation
The headline Barometer measure shows that the nation’s financial resilience continued to deteriorate in 2023. The national average score dropped by 0.5 points in 2023 to 60.9, meaning that since the onset of the cost of living crisis, around 30% of the gains realised over the pandemic have been wiped out. However, the rate of deterioration is slowing, as the fall in 2023 is smaller than the change seen over 2022. Despite this bleak picture, the hit to financial resilience would have been much worse without government support schemes, such as the Energy Price Guarantee and Cost of Living Payments, which have provided vital support to households over this period.
Fig. 5. How national financial resilience has changed from pre-pandemic to 2023Q4
Source: Oxford Economics
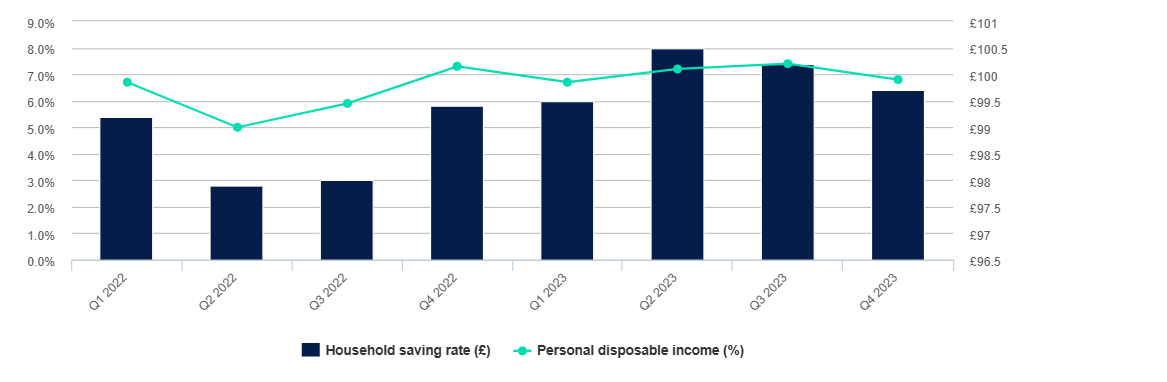
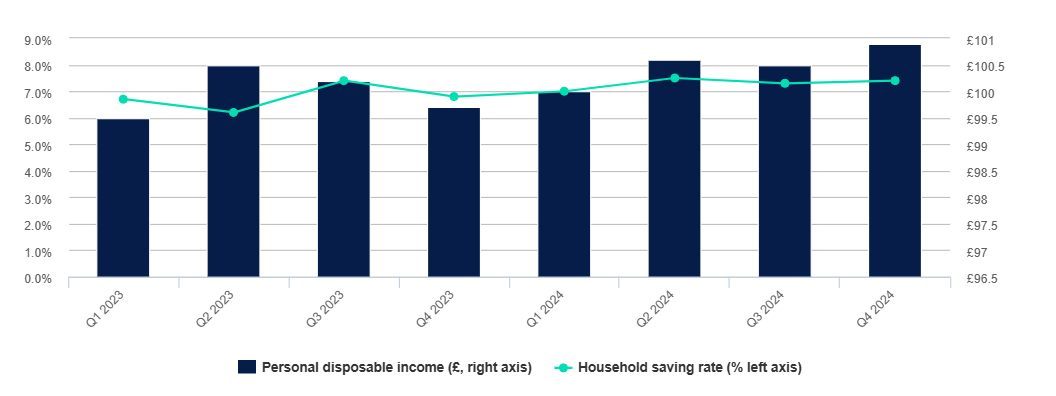
Despite fluctuations throughout the year, household disposable income in 2023 Q4 is expected to be broadly the same as it was in 2022 Q4
Government support, strong wage growth, and the onset of declining inflation resulted in real household disposable income growth of 1.1% in the first half of 2023, easing the financial burden on households. However, these gains are predicted to unwind in the second half of 2023, driven by inflation that remains above its 2% target. This will mean real household disposable income is predicted to finish 2023 at a lower level than that seen at the end of 2019. The savings rate is expected to follow a similar pattern over 2023, peaking in 2023Q3 before ending the year at 6.8%, 0.5 percentage points below the rate seen in 2022Q4.
Fig. 6. Household disposable income held-up over 2023 despite the cost of living crisis*3
Source: Oxford Economics
The cumulative price increases seen over the cost of living crisis have left many households financially strained
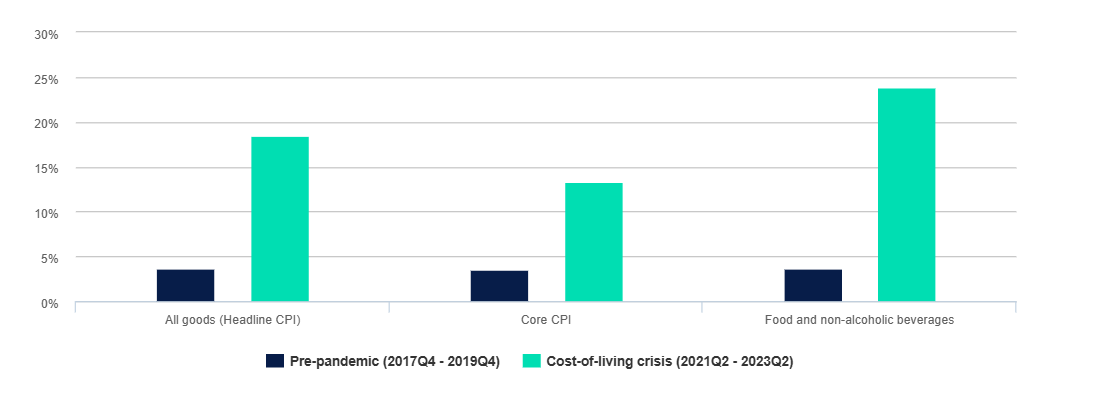
Focusing just on the annual rate of inflation can mask the cumulative effect of a sustained period of high inflation. Over the last two years, households have endured an 18.4% increase in the cost of living, which is five times the rate of consumer inflation seen in the two years leading up to the pandemic. The headline rate masks the greater challenges faced by lower-income households as they spend a larger proportion of their budgets on food and non-alcoholic beverages*4. Data from the latest Living Costs and Food Survey (LCFS) show that households in the lowest income quintile spent 16.6% of their income on these items, over three times as much as the highest income quintile who only spend 5.3% of their income on food and non-alcoholic beverages. Lower income households also have fewer cheaper alternatives and are less able to cut back on non-discretionary consumption. These households will therefore have been disproportionately affected by the 23.9% increase in food and non-alcoholic beverages prices since the start of the cost of living crisis.
Fig. 7. The cumulative change in price over the cost of living crisis has been exceptionally high
Source: Oxford Economics
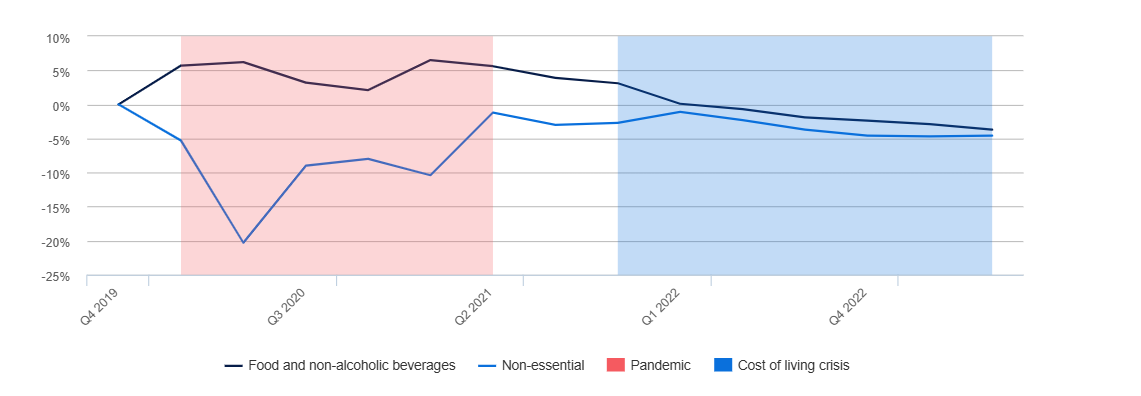
Food and non-alcoholic purchases, on a per-person basis, have fallen throughout the cost of living crisis and were 3.7% below their pre-pandemic level in 2023Q2. Over this period, despite seeing less significant increases in prices, non-essential spending has consistently remained further below its pre-pandemic level than food and non-alcoholic beverages spending. This suggests that households are prioritising cutting back on non-essential spending where possible. However, for some households the scope to cut back is limited and the number of people using a food bank for the first time increased by 38% in 2022/23*5.
Fig. 8. Volume changes in per-person food vs non-essential spending
Source: Oxford Economics
Despite large-scale government support, the cost of living crisis has eroded much of the financial resilience gains realised during the pandemic
At the end of the pandemic in 2021Q3 the nation’s financial resilience score was 62.3 points, up by 4.4 points on its pre-pandemic level. These gains came despite large fluctuations in GDP over this period, as household incomes remained relatively resilient due to government support schemes and spending opportunities were limited by lockdowns. The cost of living crisis has unwound around 30% of the pandemic period gains. Most of this fall occurred in the early phase of the cost of living crisis. Since 2022Q2 government support schemes, such as the Energy Price Guarantee and Cost of Living Payments, have helped to stabilise the Barometer score. However, a closer examination of the Barometer’s five pillars and how different household types have fared over this period highlights significant variation below the headline Barometer measure.
Fig. 9. There have been significant swings in the headline Barometer score in recent years
Source: Oxford Economics
The 'save a penny of a rainy day' pillar has driven much of the change in the barometer over the pandemic and cost of living crisis
The ‘Save a penny for a rainy day’ pillar has increased substantially since 2019, and this has been the primary driver of changes in the headline Barometer score over this period. The increase during the pandemic was the result of the savings rate reaching a high of 17.4% in 2020. Less than 30% of these gains have been unwound during the cost of living crisis as the savings rate has remained above pre-pandemic levels.
The ‘Control your debt’ pillar exhibited improvement during the pandemic as households paid off debts and maintained low arrears. However, amidst the onset of the cost of living crisis, the improvement in the pillar score has stopped. The rise in arrears and debt anxiety has more than offset improvements seen from the ongoing shift towards fixed-rate mortgages and the effective reduction of the real cost of debt.
The ‘Plan for later life’ pillar also made an important positive contribution over the pandemic period driven by strong asset price growth, higher house prices, and households using their surplus savings to build asset wealth. Since the start of the cost of living crisis, there has been a turnaround in these patterns: global share prices have dropped from their peak in 2021Q4, housing prices began falling in early 2023, and there has been a decrease in household savings.
Fig. 10. ‘Save a penny for a rainy day’ has driven the changes in the headline Barometer score
Source: Oxford Economics
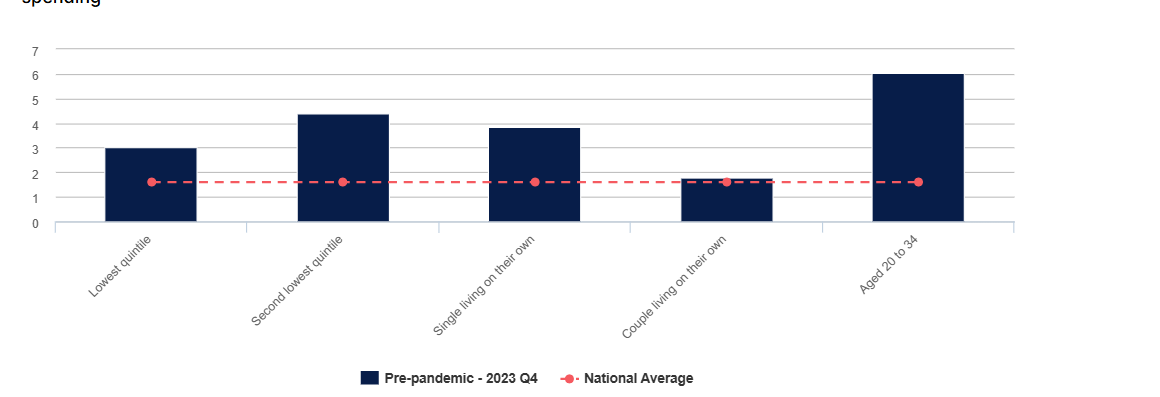
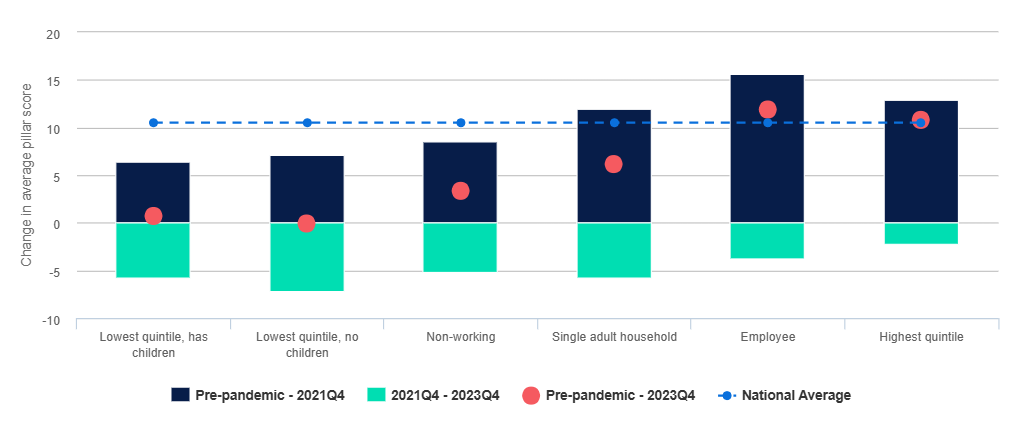
This edition has incorporated information on changes in households’ asset allocation and the number of new investors leveraging insights from the latest Financial Lives Survey*6. These insights have enabled us to extrapolate the ‘Invest to make more of your money’ pillar for the first time (further detail on the methodology can be found below). The survey indicates that the share of adults holding an investment product increased from 32% to 37% between 2020 and 2022. This rise in investors has led to an increase in the ‘Invest to make more of your money’ pillar since 2019*7. As shown in Fig. 11, this pattern was highly associated with age, as many younger adults became investors. Also, having started from a lower average score, lower income households and single adult households saw large increases.
Fig. 11. The characteristics associated with new investors are also associated with having less coverage of essential spending
Source: Oxford Economics
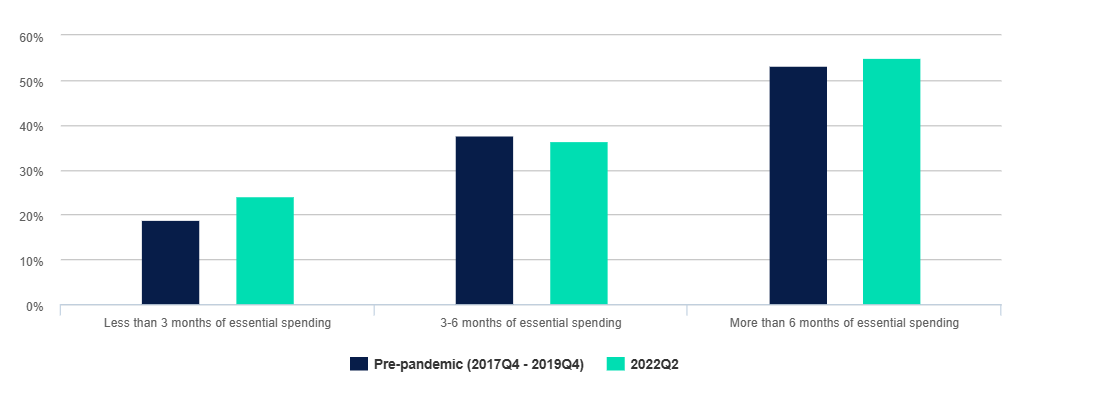
Our analysis indicates that the characteristics of new investors are associated with households that have less coverage for essential spending. We estimate that the proportion of households who are both investing and hold less than three months of essential spending in liquid savings has risen from 18.9% to 24.2%. These households are likely to be more exposed to a temporary financial shock. It is important to note that although various investment products saw increases in holdings, the FLS survey revealed a large rise in holdings of cryptocurrencies or crypto assets. New investors in this space tend to be younger and less wealthy compared to the average investor.
Fig. 12. The characteristics associated with new investors are also associated with having less coverage of essential spending
Source: Oxford Economics
The headline barometer score masks a significant increase in the inequality of financial resilience across Great Britain
Compared to 2019, the financial resilience gap between the lowest and highest quintiles has expanded by 4.5 points, from 36.3 points to 40.8 points, in 2023Q4. Indeed, the highest quintile has experienced a notable rise in the proportion of households with 'good' or 'great' financial resilience, increasing from 76.9% in 2019 to 86.2% in 2023Q4. Conversely, the lowest quintile witnessed a fall in this proportion from 3.1% to 2.3%.
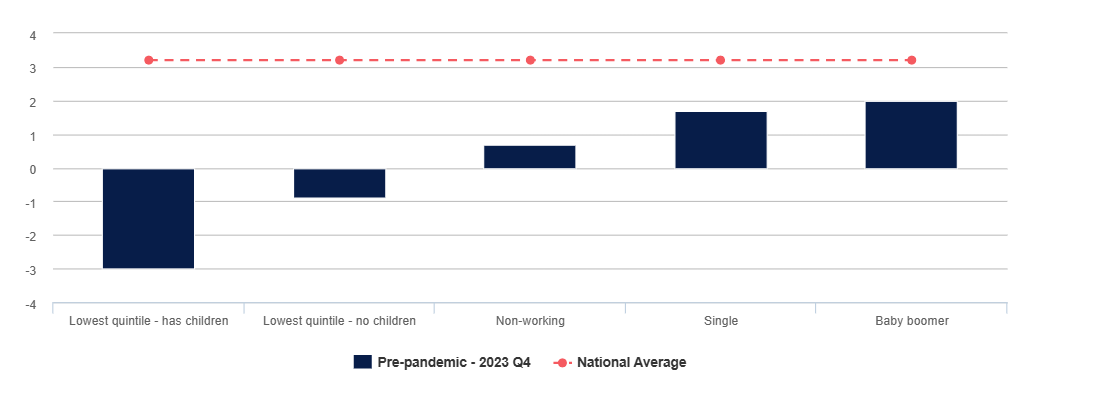
As illustrated in Fig. 13, lower income households with children have seen a large decline in financial resilience since 2019. The financial resilience scores of other vulnerable groups, such as non-working and single adult households, have also failed to keep pace with growth in the national average. This divergence has been underpinned by several factors.
Fig. 13. Winners and losers since 2019, overall barometer
Source: Oxford Economics
During the pandemic, lower income households were less able to take advantage of the savings created from remote working and the forced reduction in discretionary spending. By the end of 2021Q4, 95% of the highest quintile had a ‘good’ or ‘great’ financial resilience in the ‘Save a penny for a rainy day’ pillar compared to only 4.6% in the lowest quintile, which illustrates the challenges they faced going into the cost of living crisis. During the cost of living crisis, these vulnerable households were the hardest hit by rising prices. Overall, this means that over the past three years better off households have significantly improved their ‘Save a penny for a rainy day’ pillar score, whilst vulnerable households have only seen marginal improvements or no improvement at all (Fig. 14)*8.
Fig. 14. Winners and losers since 2019, ‘Save a penny for a rainy day’ pillar
Source: Oxford Economics
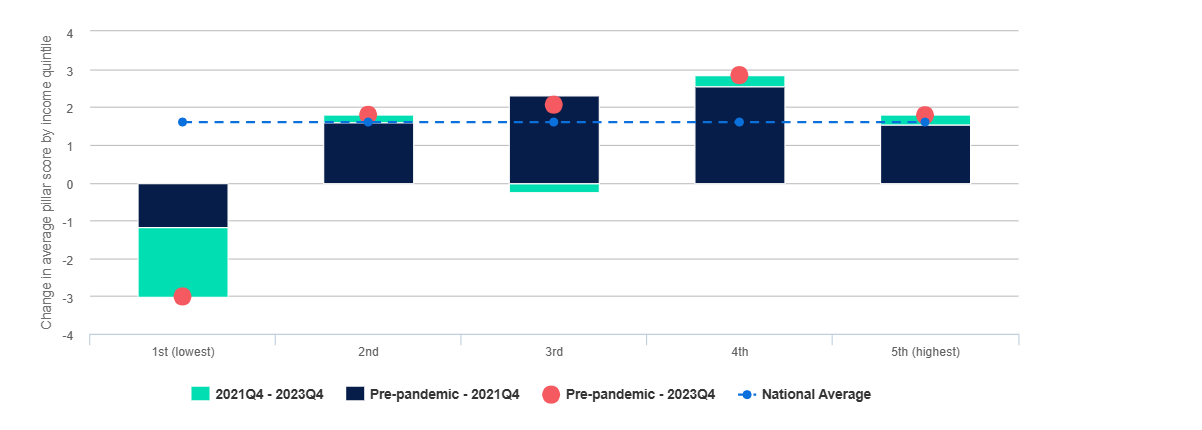
Despite the government’s direct support to households through the cost of living crisis, the prolonged crisis has posed significant challenges for households striving to meet their financial needs. As a result, debt became more of an issue in 2022 with Ofgem data showing more households were falling behind with their energy bills. During the first two quarters of 2023, there has been a limited fall in those behind on payment, but there are still 25% more households in arrears in 2023Q3 compared to 2019Q4.
Our analysis indicates that the increase in arrears is predominantly seen in low-income and non-working households, the same cohorts that struggled through the pandemic. This has led to a decline in the ‘arrears’ indicator scores for these cohorts. The lowest income quintile saw this indicator score fall by 6.2 points, while those non-working households fell by 9.2 points compared to the pre-pandemic score. In comparison to the national average, these cohorts experienced declines of four and five times the national average respectively. These households have also seen a rise in anxiety and stress, which is reflected in the 'subjective evaluation of debt position' indicator. As a result, the lowest quintile has seen the ‘Control your debt' pillar fall by 3.0 points in 2023Q4 compared to the pre-pandemic, while the other four quintiles have seen their scores rise (Fig. 15).
Fig. 15. ‘Control your debt’ pillar by income quintile since 2019
Source: Oxford Economics
Sharp increases in interest rate rises have shone a focus on homeowners, but renters remain a far less financially resilient cohort
The impact of higher interest rates on homeowners’ financial resilience has been an area of focus for policymakers, and a topic that has been investigated in previous editions of this report. However, renters are far less financially resilient than homeowners, and over two-thirds of renters are categorised as having either ‘very poor’ or ‘poor’ financial resilience scores in 2023Q4*9. Even among homeowners who have recently taken on mortgages at higher interest rates, only around a quarter of this group falls into the ‘very poor’ or ‘poor’ financial resilience category. At the recent Autumn Statement, in recognition of the challenges faced by renters, the government announced that Local Housing Allowances rates would rise to the 30th percentile of local market rents in 2024. This is estimated to benefit 1.6 million low-income households*10.
Within the Barometer, renters will score particularly poorly in the ‘Plan for later life’ pillar underpinned by the homeownership indicator. Homeowners possess two advantages over renters: they own an asset that could be liquidated if necessary, and once their mortgage is settled, their expenses are expected to be lower. These aspects contribute significantly to enhancing the financial resilience of homeowners compared to renters.
Fig. 16. Improvements in the Barometer score for renters: mixed fortunes across groups
Source: Oxford Economics
Since 2019 the Barometer score for renters has increased by 3.2 points, a marginally higher rise than the 2.8 point rise seen in the homeowner cohort. However, more vulnerable renters, such as those on low incomes or living on their own have fared worse over this period. Renters in the lowest income quintile with children, who have experienced a 3.0 point fall in their financial resilience, have been particularly hard hit. Indeed, the 6.1% increase in private rental prices in the 12 months to October 2023*11, which is over four times higher than the average annual rate seen in the five years leading up to the cost of living crisis. Similarly, with social housing rent linked to inflation, the higher housing cost will have put particular strain on renters in 2023.
Fig. 17. Low and stable household disposable income growth is expected in 2024
Source: Oxford Economics
Outlook for the next 12 months
Household disposable income growth is expected to be muted in 2024
We expect macroeconomic conditions to stabilise in 2024, meaning the outlook for households is less gloomy than it has been in recent years. However, in our baseline forecast, real disposable income growth is projected to be muted over the coming 12 months and real disposable income is expected to increase by 1.1% between 2023Q4 and 2024Q4. Anticipated gains stem from the recently announced cut to National Insurance contributions and a gradual decline in inflation toward the target rate. However, this growth is restrained by a slowdown in pay increases and the fiscal drag, which elevates the tax burden on households.
While the median employee earning £27,000*12 is expected to gain £288 from the National Insurance contribution reduction, once the freeze in income tax and National Insurance thresholds are factored in, they will only see an increase of £13 in their disposable income and individuals earning below the median are expected to be worse off. In contrast, an employee earning £50,000 stands to be £473 better off with those above this threshold gaining £172*13. The saving rate over 2024 is expected to remain elevated above its pre-pandemic level as households cut back on spending.
Fig. 18. As the UK comes out of the cost of living crisis, a more stable macroeconomic outlook is expected to reduce variation in the Barometer
Source: Oxford Economics
A stable outlook for the barometer hides variation across the pillars
Reflecting a steadier macroeconomic outlook, our forecast for the headline Barometer score is relatively stable over 2024 compared to recent years. The score is expected to be around 60.9 across 2024, remaining above its pre-pandemic level despite the cost of living crisis. The headline score conceals a notable increase in the ‘Save a penny for a rainy day’ pillar that is caused by an increase in the savings rate, but these gains are largely offset by a fall in the ‘Plan for later life’ pillar.
Fig. 19. Households’ long-term financial resilience is expected to be hit in 2024
Source: Oxford Economics
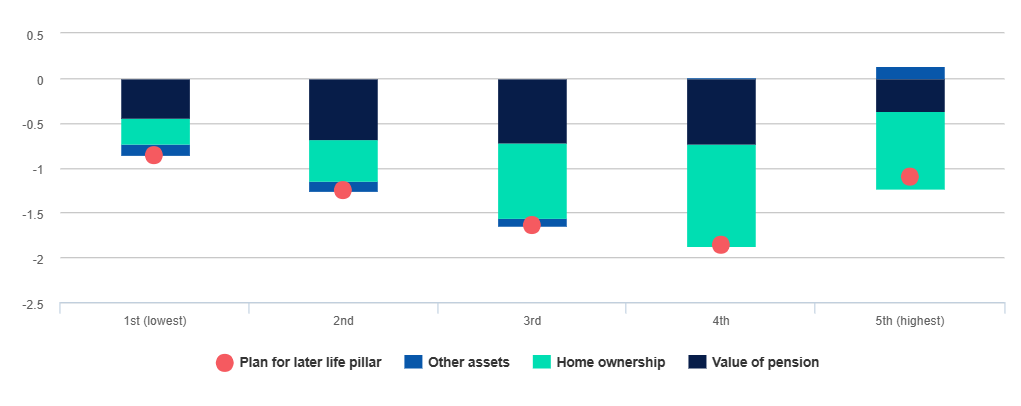
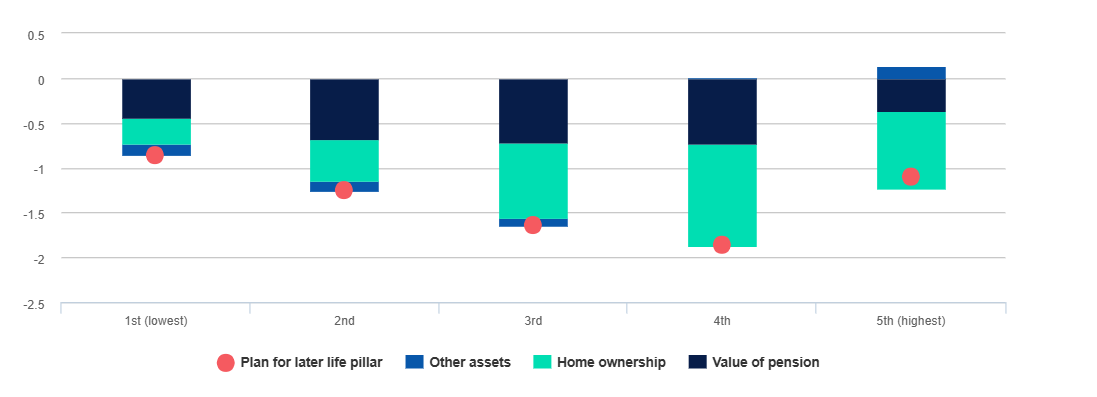
Falling house prices and continued high inflation are expected to impact households' ability to plan for retirement...
The poor performance of the ‘Plan for later life’ pillar score in 2024 is primarily driven by a projected 5.9% fall in (nominal) house prices. Such an outcome would not be evenly distributed across households with those in the third and fourth income quintiles being hit particularly hard. This is because homeowners in these quintiles typically hold lower equity shares in their property making them more vulnerable to falls in house prices. In addition to this, the indicator for 'pension value' continues its downward trajectory, as contributions and the rise in asset prices fail to counterbalance the effects of rapid inflation on the savings required for a moderate standard of living upon retirement.
Fig. 20. Households’ long-term financial resilience is expected to be hit in 2024
Source: Oxford Economics
...and downside risks in asset markets would result in a further deterioration in households' ability to plan for the future
As the economy comes out of the cost of living crisis the risk of a recession remains elevated. In this section, we use scenario analysis to assess the impact on the Barometer of a severe downturn in domestic and international asset markets. In this scenario, core inflation slows less sharply than expected and this prompts further aggressive interest rate tightening. This has a knock-on effect on asset prices reducing the average UK house price by 12.9% and slashing global stock market value by nearly 25.0%.
Fig. 21. In our asset price crash scenario house prices and financial markets decline sharply
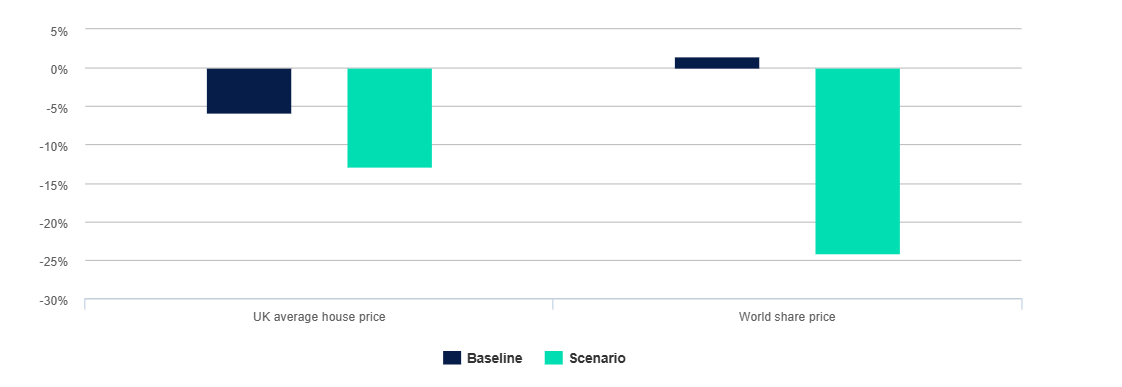
Source: Oxford Economics
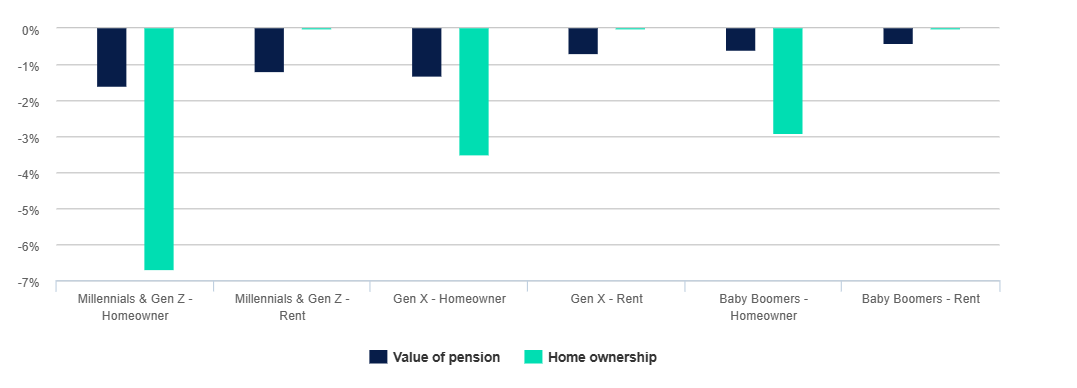
The materialisation of this risk would trigger a recession in 2024, hitting consumers’ disposable income. The specific characteristics of this scenario would mean that the ‘Plan for later life’ pillar would be most impacted. Unsurprisingly, in this scenario, homeowners see a large hit to their long-term financial prospects driven mostly by changes in their ‘Plan for later life’ score which falls by 2.1 points.
The long-term financial resilience of younger generations is particularly impacted in this scenario. The ‘Home ownership‘ indicator for homeowning Millennials and Gen Z falls by 6.7 points as this cohort holds more mortgage debt, making the equity in their home more vulnerable to falls in house prices. The fall in the ‘Value of pension’ indicator, which results from younger households’ pensions being more exposed to stock market fluctuations, means the long-term financial resilience of renters is also hit in this scenario.
Fig. 22. The cumulative change in price over the cost of living crisis has been exceptionally high
Source: Oxford Economics
Despite the forecast fall in inflation, high interest rates are expected to persist over 2024, reducing the financial resiliance of mortgage holders
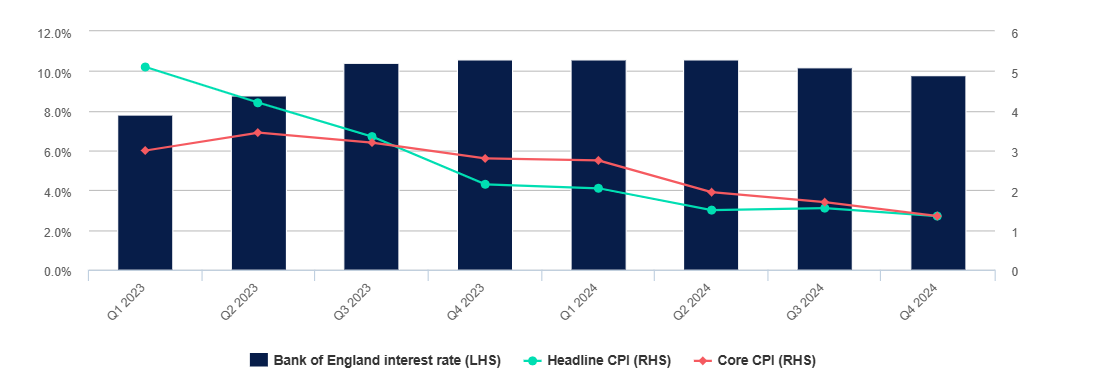
Headline and core inflation are both forecast to fall across 2024, nearing the Bank of England’s 2% target in 2024Q4. However, we expect the Bank Rate to remain at 5.25% through the first half of 2024 and then be cut by just 0.25 points in both Q3 and Q4 given rate setters’ continued concerns that high inflation could persist. The gradual lowering of the Bank Rate combined with continued growth in the proportion of homeowners on higher rate fixed mortgages means the share of mortgage holders at risk will continue to remain elevated.
Fig. 23. Falling inflation across 2024 is expected to result in the Bank of England starting to gradually lower interest rates in the second half of the year
Source: Oxford Economics
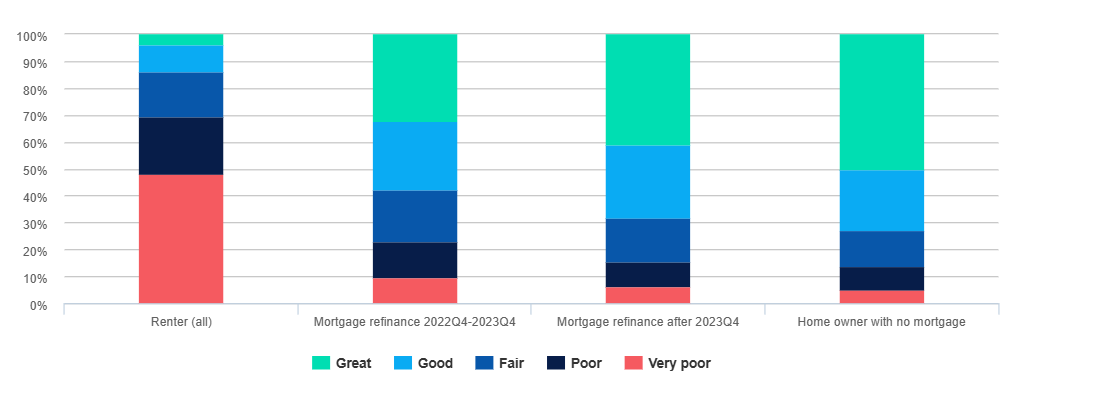
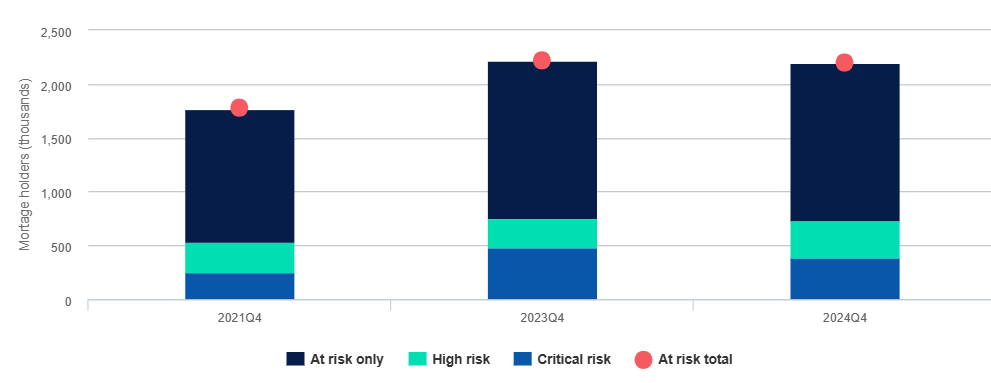
The holistic nature of the Barometer allows insights into the evolution of specific risks faced by mortgage holders over the cost of living crisis. In line with previous Hargreaves Lansdown reports, we have designated households as ‘at risk’ when their payments are expected to exceed 25% of the household’s net (after tax) income. Additionally, we have developed categorisations using the barometer dataset to identify those who may be struggling to cope with higher repayments causing significant financial stress. These additional categories are:
High risk: households with inadequate cash savings—less than three months of essential spending.
Critical risk: At-risk households who combine inadequate savings with current unsustainable spending.
As shown in Fig. 16, one in four mortgage holders are expected to be ‘at risk’ in 2024Q4 with mortgage repayments exceeding 25% of their disposable income. The share of mortgage holders with unsustainable spending (at ‘critical risk’) is expected to fall to 4.7% in 2024Q4, however, this still represents 390,000 households and is significantly above the 3.0% share seen before the onset of the cost of living crisis. Those at ‘high risk’ represent 340,000 households and 4.0% of mortgage holders.
Fig. 24. The expected fall in interest rates in the second half of 2024, is not expected to have a significant effect on the share of mortgage holders at risk
Source: Oxford Economics
Key statistics from the barometer: variation in financial resilience across the nation
Financial resilience is closely correlated with income, age, employment status, and household composition. Ultimately every household’s financial position will reflect a mixture of their socioeconomic position, composition and decisions that they make on how to use their income. These charts help to illustrate how the variation that does exist is associated with various indicators that relate to these factors.
Household Income
Fig. 25 shows how closely financial resilience is correlated to household income, with almost symmetric results between the lowest and highest income quintiles:
89.3% of the lowest income quintile have poor or very poor levels of financial resilience, while around 86.1% of the highest income quantile have good or great levels of financial resilience.
Around two thirds of the second income quintile have poor or very poor levels of financial resilience, while just over two thirds of the fourth income quantiles have good or great levels of financial resilience.
This leaves around a third of the middle-income quintile with poor or very poor levels of financial resilience. These households on middle incomes would typically have the means to build their financial resilience but many are struggling to do so at present due to the cost of living crisis.
Fig. 25. Distribution of Barometer category scores by household income (Q4 2023)
Source: Oxford Economics
Household Family Type
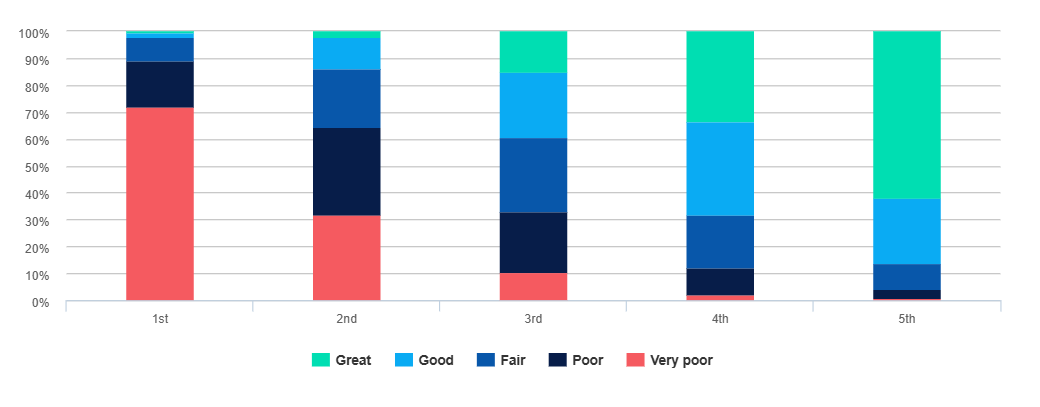
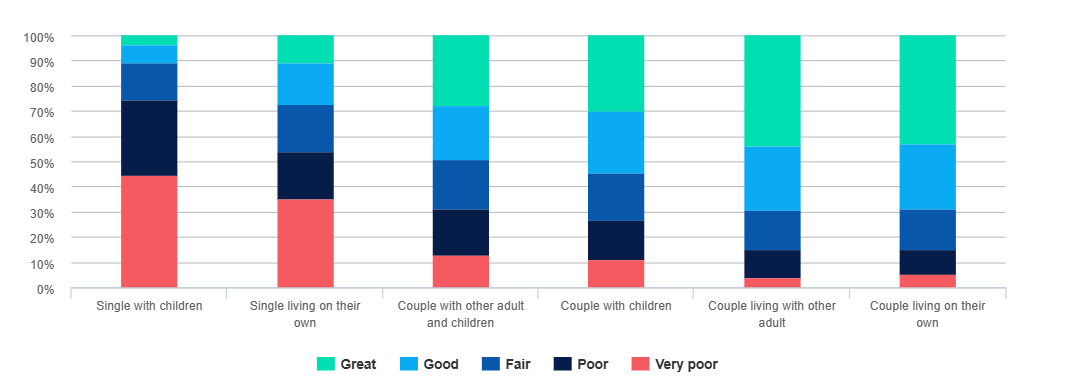
Fig. 26 provides a clear demonstration of how sharing a household with other adults, be it as part of a couple or another adult, is strongly correlated with higher levels of financial resilience. Partly this will be the effect of additional incomes in the household, partly it will be the sharing of costs but there may be additional assistance to manage financial administration to ensure all financial commitments are met and plans for the future can be made.
Fig. 26. Distribution of Barometer category scores by household family type (Q4 2023)
Source: Oxford Economics
Age
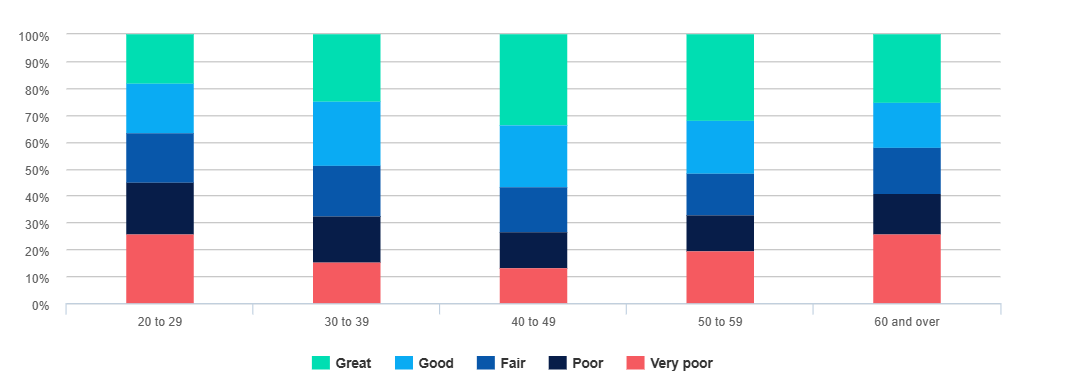
Fig. 27 shows how financial resilience is typically highest amongst households where the primary income earner is aged between 40 and 49. Some of this effect may be a result of peak earnings, while some family costs may begin to reduce. Additionally, increasing proximity to retirement may result in additional planning for retirement.
Fig. 27. Distribution of Barometer category by age of household reference person (Q4 2023)
Source: Oxford Economics
Employment
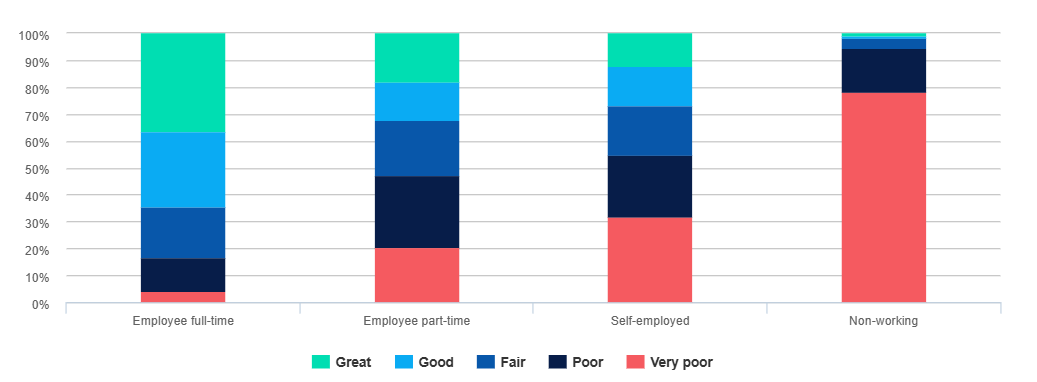
Fig. 28 shows very clearly how employment is an important predictor of financial resilience. The employment status of a household is determined by the employment status of the main earner. Notably, part-time employees and the self-employed appear to have very similar levels of financial resilience, suggesting that the loss of income from working part-time has a similar effect to the reduction in support from working from an employer who may be able to provide financial benefits, such as a workplace pension. Unsurprisingly, those who are not working are extremely likely to suffer from low levels of financial resilience.
Fig. 28. Distribution of Barometer category by household employment status (Q4 2023)
Source: Oxford Economics
About the barometer
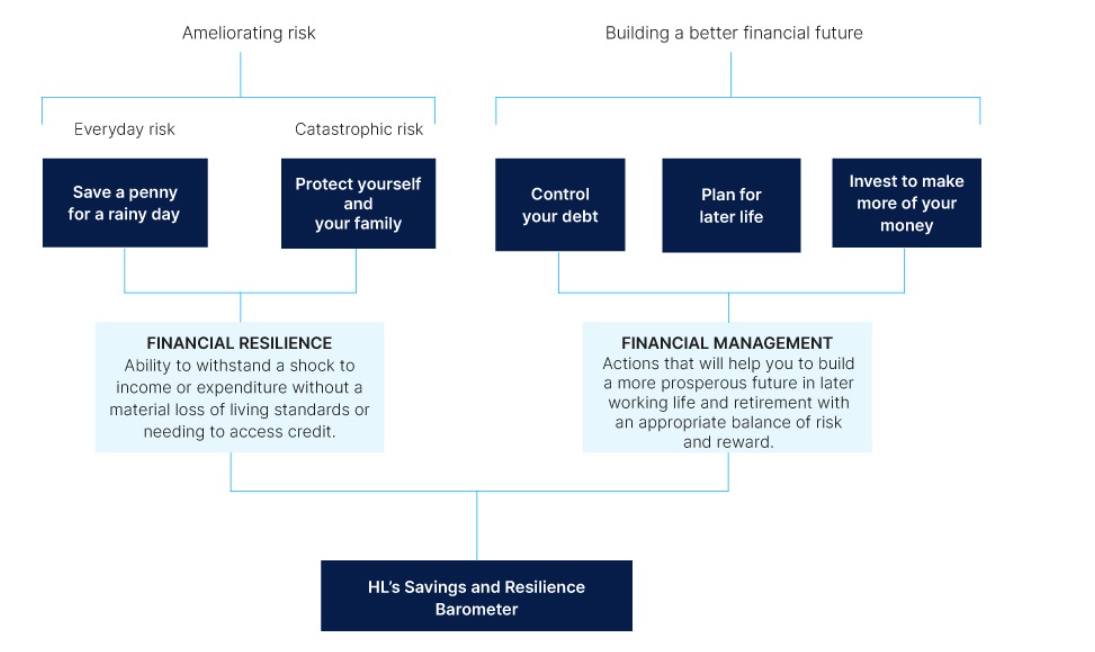
The savings and financial resilience barometer is an index measure designed and produced by Oxford Economics. It is based around Hargreaves Lansdown’s five building blocks for financial resilience depicted in Fig. 29. The aim of the barometer is to provide a holistic measure of the state of the nation’s finances, monitoring to what extent households are prudently balancing current and future demands whilst guarding against alternative types of risk.
Fig. 29. Savings and Resilience Barometer: conceptual structure
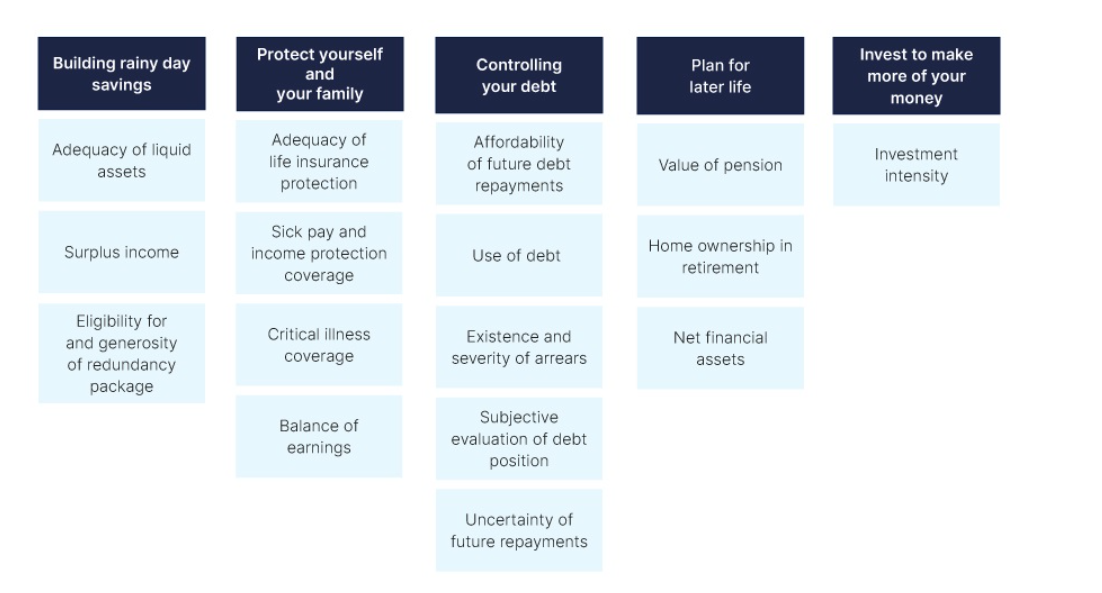
In collaboration with Hargreaves Lansdown, Oxford Economics mapped each of these pillars to a list of 16 individual indicators (Fig. 30). The data underpinning the indicators are sourced from a household panel dataset for a representative group of British households developed by linking together official datasets. The Wealth and Assets Survey (WAS), published by the ONS, has been used as the core dataset due to the breadth of financial data available in the survey. This source does not include every variable required to measure the factors and the latest survey only extends as far as 2020 Q1. Therefore, we have used a range of methods including econometric analysis to build upon the core dataset using data from the Financial Lives Survey (FLS), Living Costs and Food Survey (LCFS) and the Labour Force Survey (LFS).
For each indicator, the data were used to create an index value on a scale of between zero and 100 for households in the panel. In each case, a score of 100 was assigned to households who had reached a specified resilience threshold e.g., holding liquid assets equivalent to at least three months of essential expenditure. Households whose savings are sufficient to cover more than three months of spending are, therefore, not rewarded for this additional level of security. Such a design is appropriate to capture the concept of resilience and the intrinsic trade-offs involved in financial management. Threshold values are defined with reference to benchmark recommendations where available and, where not, using the statistical distribution of values within the dataset and the judgement of the research working group.
Fig. 30. Savings and Resilience Barometer: Barometer Indicators
Threshold values are defined with reference to benchmark recommendations where available and, where not, using the statistical distribution of values within the dataset and the judgement of the research working group.
To bring the dataset up to date, values have been extrapolated through to 2023Q2 using a wide range of macroeconomic and survey data and different modelling techniques. A much more detailed description of the approach can be found in the methodology report available on the project’s landing page*14. Finally, current and future values are projected based on Oxford Economics’ baseline forecast for the UK economy from its Global Economic Model (GEM).
To aid the communication of the barometer results, we have designed a method to allocate households between five bands according to their barometer scores. These bands are labelled as: very poor, poor, fair, good, and great. We will use the share of households in each band as a reference point to communicate the changing state of financial resilience in the UK.
The bands are primarily based on the quintile distribution of pre-pandemic barometer scores. The pre-pandemic distribution of ‘Control your debt’, ‘Invest to make more of your money’ and to a lesser extent ‘Protect Yourself and Your Family’ have been adjusted to take account of the nonlinear distribution of scores. Threshold scores for each band are fixed to values observed in the pre-pandemic (2019) period so that changes in the shares can be used to trace developments over time.
Fig. 31. Score range and pre-pandemic (2018Q1-2020Q1) proportion of households
Score range
| Band | Save a penny for a rainy day | Protect Yourself and Your Family | Control Your Debt | Plan for Later Life | Invest | Overall Index |
|---|---|---|---|---|---|---|
| Very poor | 0-28 | 0-42 | 0-54 | 0-8 | 0 | 0-42 |
| Poor | 28-50 | 42-67 | 54-66 | 8-36 | 1-19 | 42-55 |
| Fair | 50-72 | 67-76 | 66-78 | 36-61 | 19-52 | 55-65 |
| Good | 72-89 | 76-88 | 78-95 | 61-79 | 52-82 | 65-74 |
| Great | 89-100 | 88-100 | 95-100 | 79-100 | 82-100 | 74-100 |
Pre-pandemic proportion of households
| Band | Save a penny for a rainy day | Protect Yourself and Your Family | Control Your Debt | Plan for Later Life | Invest | Overall Index |
|---|---|---|---|---|---|---|
| Very poor | 20 | 17 | 19 | 20 | 55 | 20 |
| Poor | 20 | 18 | 19 | 20 | 11 | 20 |
| Fair | 20 | 26 | 19 | 20 | 11 | 20 |
| Good | 20 | 20 | 19 | 20 | 11 | 20 |
| Great | 20 | 20 | 25 | 20 | 11 | 20 |
Methodology changes
The January 2024 edition has incorporated information on changes in households’ asset allocation and the number of new investors leveraging insights from the latest Financial Lives Survey (FLS). These insights have enabled us to extrapolate the ‘Invest to make more of your money’ pillar for the first time. An overview of the methodology is found below with more details included in the methodology document.
Establishing which households are new investors
The FLS indicates that the share of adults holding an investment product increased from 32% to 37% between 2020 and 2022 and Oxford Economics have incorporated this increase in investors in the Barometer dataset. This has been estimated in three stages.
Firstly, we used a logistic regression to estimate the likelihood a respondent in the FLS was an investor in 2020 and 2022 using a model for each period. Characteristics used include personal income, age, tenure, household type, and employment status. These models are then used to estimate the likelihood of an individual being an investor in the barometer dataset. These individual likelihoods are averaged to the household level based on the individuals' income as weights.
We then ranked non-investing households by the change in likelihood between 2022 and 2020 and assumed the households with the largest increases in the likelihood were the ones that started investing. As there are differences between the proportion of investors in the FLS and WAS, we have assumed the same proportion of non-investors become investors and there are the same number of investors per household as seen in the WAS. This leads to 3.8% more households investing in the underlying dataset rising from 29.6% to 33.5%.
Finally, we extrapolate the increase in investing households between 2020Q2 and 2022Q2*15. We randomly select those households who have been identified as most likely to become an investor and equally distribute them as becoming an investor during one of these quarters. When a household becomes an investor, we redistribute their liquid assets to start investing in financial products. Based on the analysis of the FLS, we estimate that on average new investors have a smaller proportion of their assets in financial products. Reflecting this difference, the proportion of wealth held in each financial product is 80% less than the average seen in the underlying WAS dataset.
Estimating the change in households’ asset allocation
We have also developed models to estimate the change in the amount of investment products households hold as a share of their total asset allocation. For this analysis, we followed a similar approach to the new investors model. Using the FLS survey, we developed two OLS regression models to predict the share of assets held as investment products for 2020 and 2022. Characteristics used in the model include personal income, age, tenure, household type, and employment status.
We then used these models to establish the predicted change in this share between 2020 and 2022 for those households who were investors in the WAS. We then applied this change to the asset allocations of those households equally between the periods 2020Q2 and 2022Q2.
ABOUT OXFORD ECONOMICS
Oxford Economics was founded in 1981 as a commercial venture with Oxford University’s business college to provide economic forecasting and modelling to UK companies and financial institutions expanding abroad. Since then, we have become one of the world’s foremost independent global advisory firms, providing reports, forecasts and analytical tools on more than 200 countries, 100 industries, and 7,000 cities and regions. Our best-in-class global economic and industry models and analytical tools give us an unparalleled ability to forecast external market trends and assess their economic, social and business impact.
Headquartered in Oxford, England, with regional centres in New York, London, Frankfurt, and Singapore, Oxford Economics has offices across the globe in Belfast, Boston, Cape Town, Chicago, Dubai, Dublin, Hong Kong, Los Angeles, Mexico City, Milan, Paris, Philadelphia, Stockholm, Sydney, Tokyo, and Toronto. We employ 450 staff, including more than 300 professional economists, industry experts, and business editors—one of the largest teams of macroeconomists and thought leadership specialists. Our global team is highly skilled in a full range of research techniques and thought leadership capabilities from econometric modelling, scenario framing, and economic impact analysis to market surveys, case studies, expert panels, and web analytics.
Oxford Economics is a key adviser to corporate, financial and government decision-makers and thought leaders. Our worldwide client base now comprises over 2,000 international organisations, including leading multinational companies and financial institutions; key government bodies and trade associations; and top universities, consultancies, and think tanks.
January 2024
All data shown in tables and charts are Oxford Economics’ own data, except where otherwise stated and cited in footnotes, and are copyright © Oxford Economics Ltd.
The modelling and results presented here are based on information provided by third parties, upon which Oxford Economics has relied in producing its report and forecasts in good faith. Any subsequent revision or update of those data will affect the assessments and projections shown.
To discuss the report further please contact:
Henry Worthington:hworthington@oxfordeconomics.com
Oxford Economics
4 Millbank, London SW1P 3JA, UK
Tel: +44 203 910 8061
1 https://www.fca.org.uk/financial-lives/financial-lives-2022-survey
2 See the Appendix for further details on these financial resilience groupings.
3 Savings ratio calculated as household disposable income minus household consumption divided by household disposable income. This may differ from other measures of savings ratios which can include non-household specific indicators.
4 2021-22 Living Costs and Food Survey (LCFS)
5 https://commonslibrary.parliament.uk/research-briefings/cbp-9209/, https://www.trusselltrust.org/news-and-blog/latest-stats/end-year-stats/
6 https://www.fca.org.uk/financial-lives/financial-lives-2022-survey
7 The pillar is extrapolated only to 2022Q2 as that is the date of FLS and it is held constant after this period.
8 Note, the highest income quintile already had a high average ‘Save a penny for a rainy day’ pillar score in 2019, standing at 82.4 compared with the national average of 58.5. This means there was less room for improvement, partially explaining why the improvement in this pillar score for the highest income quintile was not noticeably higher than average.
9 See the Appendix for further details on these financial resilience groupings.
10 https://www.gov.uk/government/publications/autumn-statement-2023
11 https://www.ons.gov.uk/economy/inflationandpriceindices/bulletins/indexofprivatehousingrentalprices/october2023
12 Earnings and employment from Pay As You Earn Real Time Information, UK: November 2023.
13 Freeze is based on the £12,570 and £50,270 Income Tax and National Insurance thresholds and does not include any other impacts of tax changes. If these increased in line with the default rule, individuals would see the thresholds increase by 6.7%, reducing the tax paid on their earnings.
14 https://www.hl.co.uk/features/5-to-thrive/savings-and-resilience-comparison-tool
15 The 2022 FLS survey was conducted in May. As trends may have changed after this period, we have not added more investing households after this period.