Pension Adequacy – June 2025
FOREWORD BY HARGREAVES LANSDOWN
What is an ‘adequate’ pension?
The measure of what constitutes an ‘adequate’ pension pot is a critical piece of the puzzle when it comes to designing the UK’s pensions system.
There’s currently no single approach to measuring how much we’ll need in our pensions when it comes to finishing work.
Through Hargreaves Lansdown’s 4 year long partnership with Oxford Economics, we have analysed a much more holistic picture of the financial resilience of UK households, and this approach provides a greater breadth of data which can provide a more meaningful picture of what ‘adequate’ truly means.
In the recent publication of the Pensions Investment Review, the Government set out how it wants to maximise pension investment returns while simultaneously boosting UK growth.
Of course, the investment returns of a pension are a critical factor in ensuring sufficient income in retirement, but there are other, equally important, factors that must be addressed in the Review’s second phase.
This is where adequacy comes in. We firmly believe that this second phase must quickly follow the first, and must focus primarily on defining how adequacy is measured, given the far reaching consequences of this measure.
Our Savings and Resilience Barometer has sought to measure later life adequacy to date through measuring the value of pension, home ownership in retirement and other assets. It has drawn out key groups and areas where adequacy is particularly low. Our January 2025 barometer shows the groups that are on track for a moderate retirement income based on their pension savings. It transpires that:
As phase two begins a common understanding of what we as a nation class as adequacy of retirement saving is critically important. The policy response will differ depending on which measure of adequacy we are aiming for. It is also crucial as any policy interventions must balance the short and long-term resilience of households, not simply focus on pension outcomes in isolation.
Once a decision on adequacy is made, phase two of the review then has the vital building blocks and data to be able to meaningfully define what the role of the State Pension, automatic enrolment and voluntary contributions are in meeting that adequacy. This must also include the impact of housing wealth.
With all this in mind, we asked Oxford Economics to analyse what proportion of households across the Nation are currently on track to meet their retirement target using four different measures of adequacy:
The analysis combines the methodology built out for the Pension Value indicator from the HL Savings & Resilience Barometer but incorporates these benchmarks to evaluate households’ retirement resilience and provides some interesting findings.
The highlights
These benchmarks, based on an absolute pound and pence figure as opposed to a relative measure, are less applicable when assessing the extent to which individual households will be able to maintain their living standard in retirement. This is more effectively measured using the TRR and current retiree expenditure.
The chart below shows how the Nation’s resilience stacks up using these different measures at-a-glance.
Fig. 1. Retirement resilience is highest based on the Living Pension benchmark
Source: Oxford Economics
The pictures provided by these benchmarks are clearly very different. The PLSA’s comfortable benchmark understates resilience when applied to all households because it is, by design, targeting a high level of spending in retirement. On the other hand, the Living Pension overestimates resilience among wealthier households as it isn’t reflective of their current living standards. The TRR and expenditure benchmarks better account for the ability of households to maintain stability in living standards when transitioning into retirement. This variation of income required in addition to the State Pension is shown in Fig 2.
Fig. 2. Income required differ between the measures
Source: Oxford Economics
The analysis also explores how households with different levels of income are impacted by these different measures of adequacy. With the absolute measures from PLSA and the Living Pension, lower income households are seen to be fairing worse. However, when we consider the relative measures of TRR or expenditure it is the higher income households that are under saving.
Fig. 3. The pension resilience for poorer and wealthier households varies depending on the benchmark.
Source: Oxford Economics
As part of the analysis, Oxford Economics built a model to predict which households will own their own home in retirement using rental status (private vs social), income, education and childhood housing tenure. This is important as increasingly those renting in retirement will face significant challenges in meeting their living costs relative to homeowners. Both the Living Pension and current retiree expenditure benchmarks reflect these differing costs. However, unlike the expenditure benchmark, the Living Pension doesn’t factor in housing subsidies provided by the government to lower income renters which reduce this group’s out-of-pocket housing costs in retirement. As a result of this, the adequacy picture is significantly lower using the Living Pension with only 28.5% of renters on track to achieve pension adequacy in retirement, compared to 55.8% with the expenditure benchmark. However, overall the findings clearly show that renters are far less likely to meet adequacy across most measures.
Fig. 4. Homeowners have the highest level of retirement resilience
Source: Oxford Economics
Hargreaves Lansdown’s recommendations
This analysis clearly shows the importance of agreeing on a way of measuring adequacy. Failure to do so will invariably lead to confused policy making.
Having considered this research Hargreaves Lansdown has the following recommendations:
INTRODUCTION
To provide insights into the nation's retirement resilience, the Hargreaves Lansdown Savings and Resilience Barometer includes the Pension Value indicator. This indicator evaluates the expected financial resilience of households in retirement. It does this by comparing their current pension savings against the level of saving needed to achieve a benchmark income in retirement. The Pension Value indicator is currently underpinned by the Pension and Lifetime Saving Association’s (PLSA) moderate living standard in retirement benchmark.
However, there are a range of different benchmarks used to assess pension adequacy in the UK. Each of these benchmarks take a different approach to defining financial security in retirement, which means that each provides a different picture of the state of retirement resilience across the nation. This report explores the following benchmarks in depth, comparing and evaluating their implications for retirement resilience.
The income in retirement levels set by the PLSA and Living Wage Foundation are absolute benchmarks, estimating the level of income required for different standards. The PLSA minimum standard and the Living Pension are focused on the income level needed to cover essential spending, while the PLSA’s moderate and comfortable benchmarks reflect spending levels associated with differing lifestyles.
The TRR and current retiree expenditure benchmarks are relative. The TRR is designed to ensure that consumption is smoothed between working life and retirement. While the current retiree expenditure benchmark reflects the spending required to maintain consistency in living standards across generations. As the current retiree benchmark differs by income group, the measure provides a relative benchmark based on current income grouping.
It is essential for policymakers to understand the differences between these benchmarks when deciding which are most appropriate for shaping future pension reforms under phase 2 of the Pensions Review. This report first provides a detailed overview of the various benchmarks and explains how they have been integrated into the Barometer framework. It then examines pension adequacy based on each benchmark and offers insights into the implications of assessing pension adequacy through each approach.
BENCHMARKS FOR PENSION ADEQUACY EVALUATION
The variation in the benchmarks reviewed in this report is the result of the significant differences in the approaches that have been used to calculate them. This section sets out the methodological approach behind each benchmark. However, the benchmarks on their own do not provide a picture of the expected pension adequacy, this is provided by integrating them into the Barometer’s Pension Value indicator.
Adjusting the current Pension Value indicator for alternative benchmarks
The PLSA’s estimate of the income required for a moderate living standard in retirement is currently used in the Barometer. Since this PLSA estimate exceeds the state pension, after-tax private pension income must cover this gap. The size of the pension pot required to cover this gap is estimated on an age-adjusted and household type2 basis, making assumptions about households’ withdrawal rate in retirement and the inflation-adjusted return on their pension investments. Households’ current pension savings are then compared against the pension pot required to achieve the benchmark to evaluate their pension adequacy. Further details on the approach can be found in the Barometer methodology document.
Fig. 5. Summary of the methodology
Benchmark: currently, this is based on the PSLA's moderate standard of living and this will vary depending on the alternative measures.
-
1. Pension pot required
The pension pot must cover any income requirements exceeding the state pension and factor in applicable income tax.
It is assumed that individuals withdraw 4% of their pension pot annually to estimate the total amount required.
-
2. Pension pot by age
The pension pot is calculated based on expected average lifetime earnings distributed across an individual's working years.
A 3% annual rate is applied until retirement to reflect the inflation adjusted investment returns.
-
3. Change in pension pot
The values are updated each year to reflect increases in the benchmark along with changes in state pension and income tax.
In a time period where the updated values of the benchmark are unavailable, wage forecasts are used.
In this report, this Pension Value indicator approach is adapted by replacing the current PLSA benchmark with alternative retirement adequacy measures, namely the other PLSA benchmarks, the TRR, the Living Pension, and current retiree expenditure. By incorporating different benchmarks, our approach enables the differences in pension adequacy to be assessed across these benchmarks.
The PLSA’s Living Standard benchmarks
The PLSA publishes estimates for three levels of living standard in retirement—minimum, moderate, and comfortable—which vary according to relationship status. Currently, the Barometer is based on a moderate living standard that falls between the minimum and comfortable standards3. The moderate benchmark is informed by research into what the public considers an essential expenditure level at each living standard. As the public are asked about non-housing essential spending requirements in retirement, the PLSA’s benchmark should be viewed as required spending excluding housing costs.
The PLSA measures differ based on the relationship status of the household. As the relationship status of the households in retirement is unknown, a weighted average of the single and couple measures is used when calculating the benchmark thresholds for each household in our dataset4.
The PLSA has updated the income required to reach each of the three living standards in every year covered by the Barometer. To assess the change in pension adequacy over time, the 2019 values are used as the initial benchmark5, and changes in pension adequacy over time are tracked based on the new benchmark for each year and changes in households' pension savings. As the latest PLSA publication was for 2023, the 2024 values for a minimum, moderate, and comfortable standard of living were estimated based on wage growth6.
Fig. 6. PLSA income required by living standard
| Living standard | Single | Couple | ||
|---|---|---|---|---|
| 2019 | 2024 | 2019 | 2024 | |
| Minimum | £10,200 | £15,100 | £15,700 | £23,400 |
| Moderate | £20,200 | £32,700 | £29,100 | £45,100 |
| Comfortable | £33,000 | £45,100 | £47,500 | £61,700 |
Living Pension benchmark
The Living Pension, published by the Living Wage Foundation, is designed to ensure retirees can meet their basic everyday needs. The measure particularly emphasises the financial burden of rental costs, as it differs by tenure as well as relationship status7. Housing expenses in the Living Pension benchmark vary depending on whether the individual is a homeowner, social renter, or private renter. Rental costs are based on gross rental payments8.
Using the same methodological approach to the PLSA standards, a weighted average of the single and couple benchmarks is used. In addition, several Living Pension publications have been used to track the change in the benchmark over time9.
Fig. 7. Living Pension income required by tenure10
| Living standard | Single | Couple | ||
|---|---|---|---|---|
| 2019 | 2024 | 2019 | 2024 | |
| Homeowner | £10,470 | £13,950 | £16,160 | £21,540 |
| Social renter | £14,070 | £18,850 | £19,970 | £26,740 |
| Private renter | £16,000 | £21,170 | £22,450 | £29,710 |
Since the Barometer dataset does not include the expected tenure status of households in retirement, this is modelled. Homeowners are assumed to remain homeowners in retirement, while renters are assessed for their likelihood of purchasing a home before retirement. The likelihood of purchasing a home before retirement is based on the proportion of anticipated homeowners in retirement across age groups and individual household characteristics such as income, current rental status (private or social renter), education and childhood housing status.
Recent research indicates that a growing number of younger households will remain renters into retirement. The Resolution Foundation11 predict that 65% of those currently age 25 will be homeowners and 66% of those currently aged 35. This is far below the proportion for those who are currently aged 45, which is 74%. The proportion of homeownership is aligned to these proportions within the respective age groups12, and individual households are identified as being homeowners in retirement13. This modelling captures higher essential costs for those currently aged 16–64 in retirement due to the expectation that a higher proportion of these households will be renters in retirement.
Target Replacement Rate (TRR) benchmark
The Pensions Commission’s TRR is based on maintaining a similar standard of living before and after retirement, using a ratio of pre-retirement earnings. In 2004 the Pension Commission published a set of ratios that are before and after housing costs, we have used the before housing costs benchmark in this analysis. Since 2004, these ratios have been updated by the Resolution Foundation to reflect changes in the tax system14 which uplift the ratio to maintain consistency in terms of net income with the original ratios.
To calculate a household-specific benchmark in the Barometer dataset, the TRR rate is applied to the estimated pre-retirement earnings15 of each individual within a household. This involves adjusting an individual's current earnings to reflect their expected income between ages 50 and retirement16. Once pre-retirement earnings are estimated, the relevant TRR rates are applied, and the individual earnings data are aggregated at the household level to determine the required benchmark income. Based on these calculations, the median and mean income needed in retirement are £16,420 and £18,300 in 2019, respectively. Wage growth has been used to calculate the change in the benchmark since 2019. In 2024, the median and mean income required in retirement rose to £21,180 and £23,610, respectively.
Fig. 8. Original and updated target replacement rate
| Gross earnings band 201917 | Original TRR | Updated TRR |
|---|---|---|
| Less than £14,000 | 80% | 86% |
| £14,000 to £25,800 | 70% | 76% |
| £25,800 to £36,800 | 67% | 72% |
| £36,800 to £58,900 | 60% | 62% |
| Over £58,900 | 50% | 50% |
Current Retiree Expenditure benchmark
This benchmark uses retired household spending data from the Living Costs and Food Survey (LCFS) to set a threshold based on current spending patterns in retirement18. The analysis examines retiree expenditures based on income quintiles and relationship status to account for differences in spending habits. Wage growth has been used to estimate the change in the benchmark since 2019. By 2024, this has led to an increase in the pensioner expenditure benchmark by 29%.
Higher-income retirees typically spend more and have a higher standard of living, while lower-income retirees spend less, with a greater share of their budget spent on essentials. Non-retired households are matched with similar retired households based on their current income level19. This approach assumes that future retirees spending will align with comparable retirees today. For example, a high-income household is expected to have retirement expenses similar to a retired household in the same income bracket. Relationship status also plays a role, as couples benefit from shared expenses, reducing per-person costs compared to single retirees. Consistent with the other benchmarks, a weighted average of the single and couple costs is used for each household.
Fig. 9. Pensioner expenditure (excluding rental expenditure) by income quintile
For households that are renters, rental expenditure has been added on top of annual pensioner expenditure figures. Unlike the Living Pension, which includes gross rental expenses without accounting for government support, this measure accounts for housing subsidies when calculating rental costs. As shown in Fig. 10, those in the lowest income quintile pay very little in rental costs, indicating that net rental costs are an important factor in creating an accurate picture of out-of-pocket costs for retirees and a more realistic assessment of financial needs20. This benchmark also underscores the government's role in managing household costs for lower-income renters.
Fig. 10. Pensioner rental expenditure by income quintile
Comparison of income required benchmarks
The additional costs—above the state pension—that private pension savings must cover in retirement for each benchmark are shown in Fig. 1121. These figures indicate that the state pension fully or mainly covers the PLSA Minimum, homeowners' Living Pension, and the first expenditure quintile (for both renters and homeowners)—the benchmarks that align with minimum standards. However, the required income rises as the desired standard of living in retirement increases.
The PLSA’s moderate and comfortable benchmarks align closely with the fourth and fifth expenditure quintiles respectively, while the TRR’s thresholds fall between these benchmarks. In the Living Pension, the rental costs in retirement mean social and private renters need more money above the state pension. However, this is still lower than the other benchmarks by design as it focuses on minimum essential expenses in retirement.
Fig. 11. Income required differ between the measures
As shown in Fig. 12, over the 2019–2024 period the required amount of income above the state pension across has generally risen the most for benchmarks which are more applicable for wealthier households. On the other side of the spectrum, increases in the state pension have limited the change to the minimum standards that are more applicable for less wealthy households. The PLSA benchmarks have seen the largest rise, which is partly due to changes in their methodology in 202322. Indeed, the PLSA minimum benchmark now sits above the state pension, indicating that all households now need some private pension savings for this benchmark to be met.
Fig. 12. Income required has risen largest for the wealthier households, and the PLSA measures
PENSION ADEQUACY BY BENCHMARK
This section assesses the different perspective on pension adequacy offered by each of the different benchmarks. The results from this analysis offer important insights into the strengths and weakness of each benchmark.
Retirement resilience varies by measure
The proportion of households that are on track to achieve pension adequacy varies significantly based on the benchmark used. If the Living Pension is used as the benchmark, 79.1% of households are deemed to be on track. The corresponding figure using the PLSA’s comfortable benchmark provides a very different picture with just 16.1% of households on track to achieve pension adequacy.
The proportion of households on track to achieve pension adequacy using the TRR and expenditure approaches sits in the middle ground. This is because TRR and expenditure benchmarks reflect differences in retirement standards across various households. In contrast, the Living Pension and PLSA minimum represent a minimum threshold needed to ensure a basic level of financial resilience for all. While the PLSA’s comfortable benchmark is based on providing greater financial freedoms and some luxuries. As the Living Pension and PLSA living standards do not account for variations in personal retirement expectations, they may underestimate or overestimate financial resilience.
Fig. 13. Retirement resilience is highest based on the Living Pension benchmark
Homeowners outperform renters in four out of five of the benchmarks
Homeownership plays a critical role in retirement resilience, as homeowners generally require less retirement income due to the absence of rental costs. This makes it easier for them to meet pension adequacy benchmarks, as renters must accumulate significantly larger savings to achieve the same level of financial security.
The Living Pension and expenditure benchmarks are the only ones that explicitly include rental costs. The analysis shows that renters score significantly lower in the former, with the proportion of renters achieving pension adequacy based on this benchmark sitting 71.5 percentage points below the level for homeowners (Fig. 14). The proportion of renters achieving pension adequacy when the expenditure benchmark is used is higher because, unlike with the Living Pension, the expenditure benchmark factors in housing subsidies that lower-income households receive from the government that reduce their out-of-pocket housing costs in retirement.
The PLSA measures and TRR do not explicitly include rental costs but still see variations between the financial resilience of renters and homeowners when using these benchmarks. Homeowners in the PLSA measures are more financially resilient as they are typically wealthier and have larger pension savings. The difference is less stark for the TRR benchmark, with renters performing better as a large proportion of the retirement income required is covered by government support.
Fig. 14. Homeowners have the highest level of retirement resilience
Different benchmarks influence the picture on resilience by income group
The choice of benchmark also plays an important role in shaping the perception of financial resilience across income groups. When assessed using the Living Pension and PLSA benchmarks, many lower-income households appear to fall short of financial resilience. However, the Expenditure and TRR benchmarks present a significantly more favourable outlook for these households (Fig. 15). Two primary factors explain this contrast.
The financial resilience of wealthier households also varies depending on the benchmark used. The TRR and Expenditure measures better capture the rising expenses associated with higher incomes, leading to a more consistent level of financial resilience across the income quintiles. As the PLSA measures are in absolute terms, the number of households meeting financial resilience increases for higher-income groups. Many wealthy households also achieve financial resilience under the Living Pension benchmark, mainly due to high rates of homeownership.
Fig. 15. The pension resilience for poorer and wealthier households varies depending on the benchmark.
The number of financially resilient households has fallen over time
The rise in living costs has led to a fall in the proportion of households meeting the pension adequacy benchmarks in 2024 compared to 2019. In particular, the proportion of households reaching the thresholds based on the PLSA’s moderate and minimum benchmarks saw the largest fall between 2019 and 2024. Pension adequacy based on the minimum fell by 25.9 percentage points as the benchmark now requires households to have private pension savings, while the moderate benchmark fell by 13.9 percentage points as this saw the largest increase in income required to reach this standard (Fig. 16). These is significantly higher than the Living Pension and Expenditure benchmarks, which only fell by 1.0 percentage points.
Fig. 16. Retirement resilience has fallen with the PLSA measures, indicating the largest decline
Pension adequacy assessed using the PLSA minimum benchmark has declined the most among lower-income households, many of whom have little or no pension savings. The shift is the result of the fact that, unlike in 2019, pension savings are required to hit this benchmark. For the other measures, Fig. 17 shows how the increases in the State Pension have played a crucial role in supporting lower-income households, with the Living Pension and lower income groups in the TRR and Expenditure benchmarks seeing limited or no fall in pension resilience.
Declines in pension adequacy based on income quintiles have been primarily seen in the higher-income households. The rise in retirement costs has led to a larger gap with the state pension, and pension pots held by these household have not kept pace. This shows that while state support is effective in preventing poverty in retirement, it is less effective at ensuring financial continuity for middle and higher earners.
Fig. 17. Wealthier households see the largest falls in pension adequacy.
CONCLUSION
The choice of benchmark significantly impacts assessments of pension adequacy, highlighting the importance of selecting appropriate benchmarks when designing policy. Absolute benchmarks like the PLSA’s minimum living standard and Living Pension can help to unpack the proportion of households that are not on track to achieve a basic level.
However, when evaluating financial resilience benchmarks that account for varying retirement expectations across income groups - as well as relationship status and tenure type – relative benchmarks have the advantage that they best reflect changes in living standard for households moving into retirement. The TRR and expenditure benchmarks adjust based on income, making them more suitable for assessing the extent households will be able to smooth living standards into retirement.
Through this lens a larger proportion of the poorest households achieve financial resilience in retirement. On the other hand, wealthier households often show lower relative resilience, not because they cannot afford basic living costs but because they are not saving enough to maintain their current standard of living in retirement. This highlights a key challenge: while lower-income groups may rely on government support, higher-income groups face the risk of a lifestyle downgrade if they do not adequately prepare for their post-retirement financial needs.
About the barometer
The Savings and Financial Resilience Barometer is an index measure designed and produced by Oxford Economics. It is based around Hargreaves Lansdown’s five building blocks for financial resilience depicted in Fig. 18. The aim of the Barometer is to provide a holistic measure of the state of the nation’s finances, monitoring to what extent households are prudently balancing current and future demands whilst guarding against alternative types of risk.
Fig. 18. Savings and Resilience Barometer: conceptual structure
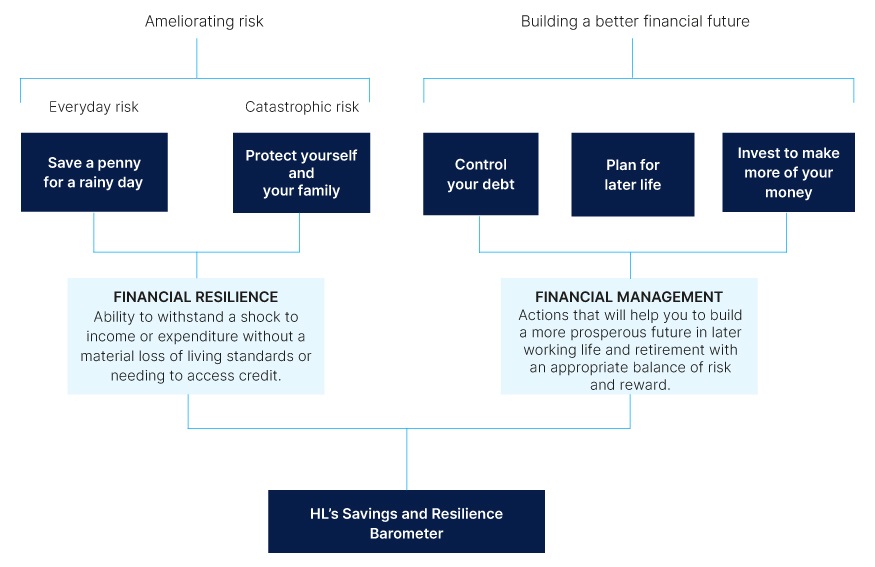
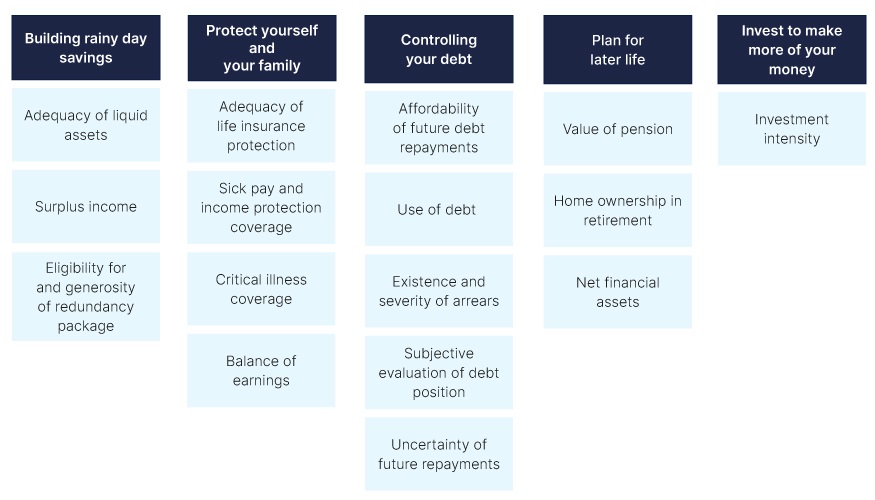
In collaboration with Hargreaves Lansdown, Oxford Economics mapped each of these pillars to a list of 16 individual indicators (Fig. 18). The data underpinning the indicators were sourced from a household panel dataset for a representative group of British households developed by linking together official datasets. The Wealth and Assets Survey (WAS), published by the ONS, was used as the core dataset due to the breadth of financial data available in the survey. This source does not include every variable required to measure the factors and the latest survey only extends as far as 2020 Q1. Therefore, we have used a range of methods including econometric analysis to build upon the core dataset using data from the Financial Lives Survey (FLS), Living Costs and Food Survey (LCFS), and the Labour Force Survey (LFS).
For each indicator, the data were used to create an index value on a scale of between zero and 100 for households in the panel. In each case, a score of 100 was assigned to households that had reached a specified resilience threshold, e.g., holding liquid assets equivalent to at least three months of essential expenditure. Households whose savings are sufficient to cover more than three months of spending are, therefore, not rewarded for this additional level of security. Such a design is appropriate to capture the concept of resilience and the intrinsic trade-offs involved in financial management.
Fig. 19. Savings and Resilience Barometer: Barometer Indicators
To bring the dataset up to date, values have been extrapolated through to 2023Q2 using a wide range of macroeconomic and survey data and different modelling techniques. A much more detailed description of the approach can be found in the methodology report available on the project’s landing page20. Finally, current and future values are projected based on Oxford Economics’ baseline forecast for the UK economy from its Global Economic Model (GEM).
Branding categories
To aid the communication of the barometer results, we have designed a method to allocate households between five bands according to their barometer scores. These bands are labelled as: very poor, poor, fair, good, and great. We will use the share of households in each band as a reference point to communicate the changing state of financial resilience in the UK.
The bands are primarily based on the quintile distribution of pre-pandemic barometer scores. The pre-pandemic distribution of “Control your debt”, “Invest to make more of your money” and to a lesser extent “Protect Yourself and Your Family” have been adjusted to take account of the nonlinear distribution of scores. Threshold scores for each band are fixed to values observed in the pre-pandemic (2019) period so that changes in the shares can be used to trace developments over time.
Fig. 20. Score range and pre-pandemic (2018Q1-2020Q1) proportion of households
Score range |
||||||
|---|---|---|---|---|---|---|
| Band | Save a penny for a rainy day |
Protect Yourself and Your Family |
Control Your Debt |
Plan for Later Life |
Invest | Overall Index |
| Very poor | 0-28 | 0-42 | 0-54 | 0-5 | 0 | 0-42 |
| Poor | 28-50 | 42-66 | 54-66 | 5-31 | 1-19 | 42-54 |
| Fair | 50-71 | 66-76 | 66-78 | 31-55 | 19-52 | 54-63 |
| Good | 71-89 | 76-88 | 78-95 | 55-75 | 52-82 | 63-72 |
| Great | 89-100 | 88-100 | 95-100 | 75-100 | 82-100 | 72-100 |
Pre-pandemic proportion of households |
||||||
|---|---|---|---|---|---|---|
| Band | Save a penny for a rainy day |
Protect Yourself and Your Family |
Control Your Debt |
Plan for Later Life |
Invest | Overall Index |
| Very poor | 20 | 19 | 19 | 20 | 52 | 20 |
| Poor | 20 | 15 | 19 | 20 | 13 | 20 |
| Fair | 20 | 26 | 19 | 20 | 12 | 20 |
| Good | 20 | 20 | 19 | 27 | 12 | 20 |
| Great | 20 | 20 | 24 | 13 | 12 | 20 |
ABOUT OXFORD ECONOMICS
Oxford Economics was founded in 1981 as a commercial venture with Oxford University’s business college to provide economic forecasting and modelling to UK companies and financial institutions expanding abroad. Since then, we have become one of the world’s foremost independent global advisory firms, providing reports, forecasts and analytical tools on more than 200 countries, 100 industries, and 7,000 cities and regions. Our best-in-class global economic and industry models and analytical tools give us an unparalleled ability to forecast external market trends and assess their economic, social and business impact.
Headquartered in Oxford, England, with regional centres in New York, London, Frankfurt, and Singapore, Oxford Economics has offices across the globe in Belfast, Boston, Cape Town, Chicago, Dubai, Dublin, Hong Kong, Los Angeles, Mexico City, Milan, Paris, Philadelphia, Stockholm, Sydney, Tokyo, and Toronto. We employ 450 staff, including more than 300 professional economists, industry experts, and business editors—one of the largest teams of macroeconomists and thought leadership specialists. Our global team is highly skilled in a full range of research techniques and thought leadership capabilities from econometric modelling, scenario framing, and economic impact analysis to market surveys, case studies, expert panels, and web analytics.
Oxford Economics is a key adviser to corporate, financial and government decision-makers and thought leaders. Our worldwide client base now comprises over 2,000 international organisations, including leading multinational companies and financial institutions; key government bodies and trade associations; and top universities, consultancies, and think tanks.
June 2025
All data shown in tables and charts are Oxford Economics’ own data, except where otherwise stated and cited in footnotes, and are copyright © Oxford Economics Ltd.
The modelling and results presented here are based on information provided by third parties, upon which Oxford Economics has relied in producing its report and forecasts in good faith. Any subsequent revision or update of those data will affect the assessments and projections shown.
To discuss the report further please contact:
Henry Worthington: hworthington@oxfordeconomics.com
Oxford Economics
4 Millbank, London SW1P 3JA, UK
Tel: +44 203 910 8061
1 The rates used have been adjusted to reflect changes in the tax system since the original were set by the Pension Commission.
2 For the PLSA benchmark household types are split into single and couple households. Household types will vary throughout the report based on the nature of the benchmark being used. For example, the Living Pension benchmark analysis splits households by couple/single and tenure status (e.g., owner, private renter, and social renter).
3 In 2023, the PLSA’s estimate for a “moderate income in retirement” rose significantly beyond the rate of inflation due to methodological changes. For consistency in the “Pension value” score over time, the indicator has been adjusted in the Barometer by applying wage growth to the PLSA’s 2023 estimate for “moderate income”. See the July 2024 edition of the report for more details. The unadjusted “moderate income” has been used in this analysis to maintain consistency with the actual benchmark reported by the PLSA.
4 Further details on this approach can be found in the Barometer methodology document.
5 2019 data are used to be consistent with the 7th Wave of the Wealth and Assets which underpins the Barometer and covers the period 2018Q2–2020Q1.
6 Average Weekly Earnings, total pay.
7 Building a Living Pension, Resolution Foundation, 2021
8 The Living Pension assumes that single pensioner households have private rent that equals the average lower quintile rent for a one-bedroom property in England. For pensioner couples, it assumes the rent reflects the average lower quintile rent for a two-bedroom property in England. Social rental payments are based on the rents in the minimum income standards (MIS).
9 2020, 2021, and 2023 published data used. 2019, 2022, and 2024 estimates were calculated based on average weekly earnings, total pay. 2020 figures from “Building a Living Pension”, Resolution Foundation, 2021. 2021 and 2023 figures from “Calculating a Living Pension: the 2024 update”, Resolution Foundation, 2024.
10 Rounded to the nearest £10.
11 Building a Living Pension, Resolution Foundation, 2021
12 Age groups include: 16-34, 35-44, 45-54, 55-64.
13 Households are identified as homeowners in retirement based on their current rental status (private or social housing), household income, parental homeownership status and education level. A logit model based on current homeowners is used to estimate the relationships.
14 Perfectly adequate?, Resolution Foundation, 2024
15 We assume that household benefits and/or investment income will remain at a similar level in retirement, considering only employee and self-employed earnings in our calculations. Consequently, households relying solely on benefits or investment income are expected to have adequate income coverage in retirement to maintain their current standard of living in retirement for this benchmark.
16 For example, a 35-year-old is anticipated to see their earned income fall by 11% compared to the average income of those aged between 50–68. We, therefore, estimate their pre-retirement earnings as £35,720 (£40,000*89%). Average earnings by age based on the LFS.
17 Average week earnings used to update the 2004 earnings groups to 2019 values.
18 Findings based on 2019/20 LCFS. Households assessed are both retired and the HRP is over 65
19 Income quintiles for non-retired are calculated and used to match with retired income quintile groups. For example, a non-retired household in the top income quintile is expected to have retirement spending comparable to that of a retired household in the same income quintile. Non-retired income quintiles are estimated within age groups to reflect changes in income over an individual’s lifetime. Age groups include: 16-34, 35-44, 45-54, 55-64.
20 The housing costs for the fifth quintile are estimated due to a limited sample. This has been modelled using the change seen in rental expenditure in the lower quintiles.
21 We assume that all retired household get the full new state pension in the modelling.
22 In the 2023 publication, additional costs were included such as financial support for family members and meals out with family. This meant the benchmark rose significantly beyond the rate of inflation.