

Financial statements come in three parts – the income statement, balance sheet and cash flow statement.
As we get closer to another busy reporting season, over the next three weeks we're going to be looking at each in detail.
We'll walk investors through each part of the statement and provide some useful tips on how to use company reports to identify a business' strengths and weaknesses.
Statements and ratios shouldn’t be looked at in isolation though. Instead, use them to form a bigger picture of company health and prospects, which can then help to inform your investment decisions.
This article isn’t personal advice. If you’re not sure an investment is right for you, seek advice. Investments and any income from them will rise and fall in value, so you could get back less than you invest.
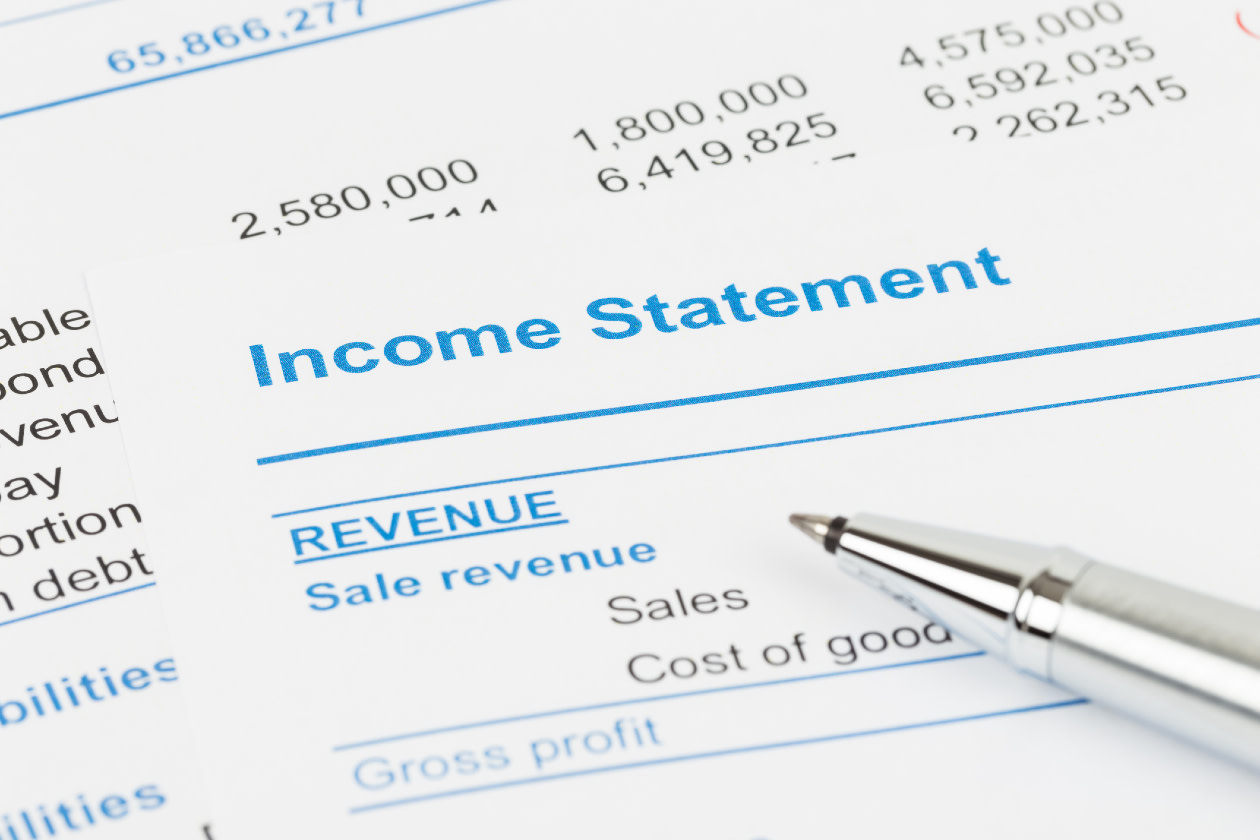
What is an income statement?
An income statement starts with revenue and gradually subtracts costs until you arrive at various measures of profit.
For this reason, revenue is sometimes referred to as the 'top line' while profits are called the 'bottom line'.
Here’s a simple example income statement below.
2024 (£ '000) | 2023 (£ '000) | |
|---|---|---|
Revenue | 5,000 | 4,024 |
Cost of goods sold | 2,000 | 1,620 |
Gross profit | 3,000 | 2,404 |
Research & Development | 310 | 300 |
Selling, General & Administrative | 250 | 205 |
Other (1) | 50 | 35 |
Total operating expenses | 610 | 540 |
Operating profit (/loss) | 2,390 | 1,864 |
Finance income | 10 | 10 |
Finance expense | 120 | 110 |
Profit before tax | 2,280 | 1,764 |
Tax | 570 | 441 |
Profit after tax | 1,710 | 1,323 |
Earnings per share (£) | 1.43 | 1.10 |
Dividend per share (£) | 0.71 | 0.55 |
False profits
One of the things you might notice about the income statement above is the various types of 'profit'.
Company management teams will often be selective about the type of profit they focus on in reports. There are good reasons for some companies to focus on profit measures that are higher up the income statement.
But always remember that ultimately, it's profits after tax that accrue to shareholders – nothing else.
Gross profit
Working from the top down, the first profit number you come across is 'gross profit'.
This essentially measures the difference between what a company pays for the goods and services it sells, and what it charges.
It's what you might think of as the 'mark-up' or gross margin a retailer puts on its stock.
The company in the example above achieved a 60% gross margin in 2024.
Operating profit
But the costs of buying or manufacturing products aren't the only costs a company faces.
There are also the costs of actually running the business day-to-day.
These are called operating expenses and include things like product development spending, head office costs and wages.
Remove all these from gross profits and you get operating profit.
You'll notice in our example we've included research and development (R&D) and selling, general and administrative expenses (SG&A), in operating expenses.
But there's also an 'other' category and this can include a whole range of things.
To find out exactly what's included, you'll have to look in the notes to the accounts – in this case note 1 (as indicated by the annotation next to the word 'Other').
One number you're likely to see included in other operating expenses is depreciation. This represents the wear and tear on company equipment during the year. Think about how a car loses value as it accrues more miles on the clock.
Wear and tear might not cost any cash upfront, but it's important that it's recognised in the overall expenses. Over time, equipment will lose value, and at some point, it'll need to be replaced.
It’s worth focusing on operating profit because it can change quite a lot quarter-to-quarter, and management has a relatively large influence on it. Sales can be boosted by marketing or pricing, and management tends to have levers it can pull to influence costs.
Pay close attention to operating margin too (the percentage of revenue that makes it through to operating profit – 47.8% for 2024 in the example above).
Operating margin gives an important measure of a company's competitive position, since it shows that customers are prepared to pay a premium for the service on offer.
Higher margins also provide a bigger cushion if business takes a turn for the worse.
Profit before tax
Looking further down the income statement, management also has some control over the finance costs, which are subtracted to get you to 'profit before tax'.
Interest costs make up most of this category, both interest payable on loans the company has taken out and interest received on cash the company holds in the bank.
The more debt a company has, the higher the interest expense.
However, most companies will only be able to shift their debt levels slowly. That makes it a less useful measure of quarter-to-quarter performance.
Profit after tax
The bottom line of the income statement is 'profit after tax', sometimes called net income or profit attributable to equity holders.
In some ways, it's the most important number on the income statement – since it represents the final profit the company actually made in the period.
However, with tax rates set by governments, it's not a number that management has direct control of.
For that reason, it can take more of a back seat when you're analysing companies.
Per share numbers
The income statement will often include an earnings per share (EPS) number.
This divides profit after tax by the number of shares in issue, giving you an idea of the profit attributable to each share.
It's a useful number for several reasons.
Firstly, you can use it to calculate a price-to-earnings ratio for the stock.
Dividing the share price by the EPS creates a standardised way to value a company – you can then use it to compare against different sized companies.
Secondly, you can use it to work out dividend cover.


This is calculated by dividing EPS by dividend per share (DPS). It tells you how many times the company would be able to pay the dividend out of this year's earnings.
A number less than one is a major warning sign about the dividend. Most of the time, a dividend coverage ratio of around two times, or higher, is much more preferrable.
A note on alternative or underlying numbers
One thing we haven't included in this summary is details on what are called 'adjusted' or 'underlying' numbers.
These numbers help give you a better understanding of what's actually happening in a business. That's because they strip out 'one-off' events that impact a company's results, but aren't an ongoing effect.
Underlying numbers can be a useful tool for investors in a year where a company has faced a significant fine or perhaps made a major acquisition. They help you see what's going on in the core business.
However, they're also compiled based on management discretion. If a company faces fines of one kind or another every year, is that really an 'exceptional' cost?
Lots of companies would argue it is, but we're not so sure.
For that reason, adjusted or underlying numbers aren't allowed in an income statement. If it's a cost, even an exceptional, one-off cost, it needs to be reflected in the income statement.
Next week
Next week, we're going to look at balance sheets, and particularly what they can tell you about a company's financial strength.
To make sure you don’t miss out, join over 170,000 subscribers and sign up to our weekly Share Insight email.
You’ll get a wealth of resources every Friday, including:
Expert commentary from our in-house team
Our latest share research updates
Share investment ideas and investing insights
What to expect from the stock market in the week ahead
From Warren Buffett’s blueprint to beating Wall Street to how to invest in value stocks, explore some of our latest and most read stock market insights.