HL SAVINGS & RESILIENCE BAROMETER - JULY 2023
You are not reading the latest version of the report, read the January 2024 HL Savings and Resilience Barometer report.
Foreword
Chris Hill, CEO, Hargreaves Lansdown
As I get to the end of my time at Hargreaves Lansdown, I am reflecting on the turbulent economic times we continue to live through. As someone running an investment business, I fully understand the need to hold tight through an economic cycle and to keep building financial resilience over the longer term.
In the fourth edition of the barometer, we can see the extent to which holding tight just isn’t an option for many. With inflation eroding purchasing power we are all feeling the pinch. But the stark position of those in the poorest fifth of the population, with debt arrears and anxiety building, is very troubling.
This impact on financial resilience today also has the potential to impact long-term resilience as well. The analysis of the later life pillar of the barometer shows the strain of asset prices and the impact of inflation on the need to build a more substantial pot to enjoy a moderate income in retirement. HL will use the barometer, with its ability to look across short and long-term impacts, to assess how the nation’s resilience is impacted in the future.
Finally, the look ahead shows how housing tenure has a dramatic impact on people’s resilience. Renters make up the largest group who have unsustainable spending, no assets and existing debt. Whilst mortgage holders, particularly the young, single and self employed, will really suffer. For those refinancing we are expecting significant hits to their level of savings.
Against this backdrop firms and employers need to do all they can to boost the financial resilience of their clients and colleagues. To this end I was delighted to launch the Bristol Financial Resilience Action Group in May this year. We are working with 18 local employers, large and small, to provide information, knowledge and help to build the resilience of up to 25,000 employees.
Whilst the economic situation remains bleak, working together to build resilience must remain our steadfast focus. We are delighted to continue to work with Government, regulators, other firms and think tanks through our Barometer Sounding Board to improve insight and share measures to tackle our financial resilience challenges.
Executive summary
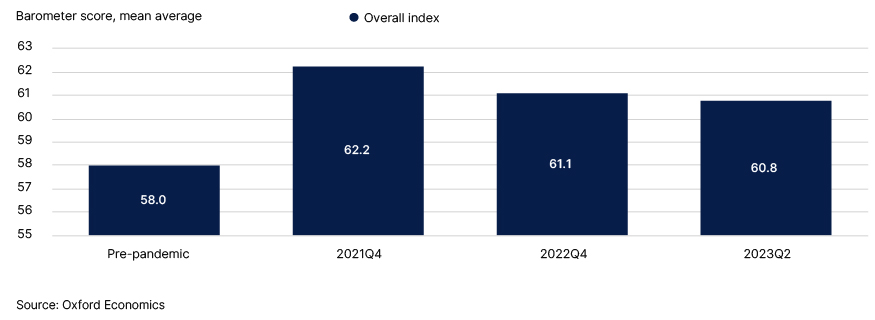
The Savings and Resilience Barometer reveals that households continue to be under financial pressure with the overall barometer score falling by 1.4 points since 2021 Q4 to 60.8 in 2023 Q2. While the aggregate score is higher than pre-pandemic levels, this is not the case for certain cohorts of the population, particularly those on low incomes. This report explores which households are facing the largest pressures on their financial resilience and why.
Debt concerns have risen as households felt the financial squeeze
While the government’s direct support packages have proved to be broadly effective at mitigating the consequences of the surge in home energy bills, the protracted nature of the ‘cost of living’ crisis has generated considerable challenges for certain households seeking to make ends meet. Indeed, one implication has been a troubling rise in problem debt, with the past 12 months having seen a significant increase in the incidence of arrears. For example, 2022 data from Ofgem show just over 30% more households are in arrears on their energy bills when compared to 2021 and close to 50% higher than pre-pandemic levels in 2019.
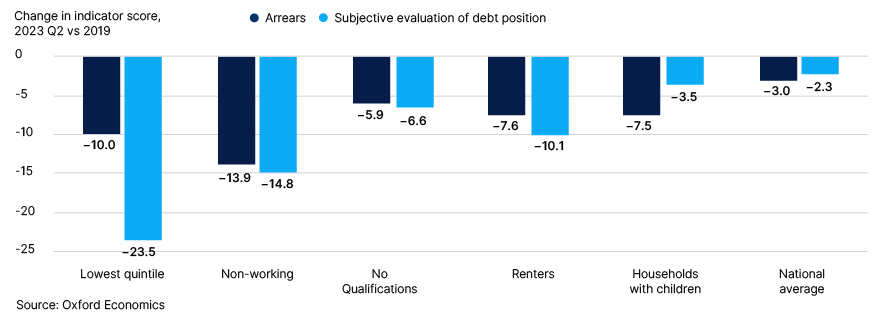
In general, our analysis shows that the rise in arrears has been concentrated among low income and non-working households. Within the Barometer, this is exemplified by trends in the ‘arrears’ indicator scores for these cohorts with declines compared to the pandemic of more than three- and four-times the national average respectively (Fig. 1). The human toll of this higher incidence of falling behind on debt payments is, of course, increased anxiety and stress, manifested through corresponding trends in the ‘subjective evaluation of debt position’ indicator.
Fig. 1. The current economic environment is causing more households to go into arrears along with raising their debt anxiety levels
Since the pandemic Britain has suffered a striking increase in the inequality of long-term financial resilience
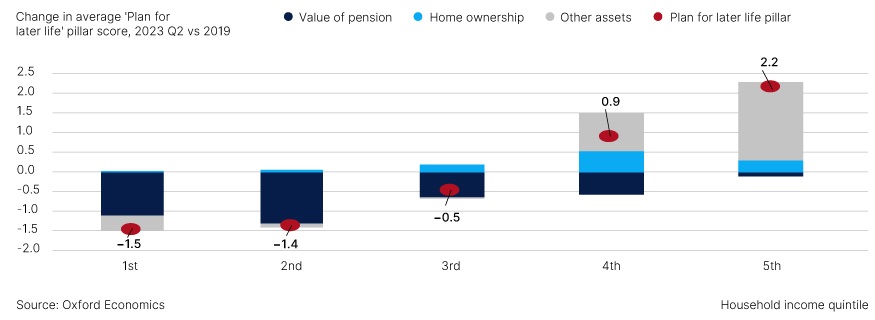
While at the national level, long-term financial resilience, as measured by the ‘plan for later life’ pillar, is virtually unchanged compared to its pre-pandemic level this overall stability masked a very uneven pattern across the nation. As shown by Fig. 2, lower income households, again, fare far worse-than-average, a trend that has exacerbated inequality in long-term financial resilience. The driver of this shift has been the variation in changes in savings rates since 2019 with low income households less likely to work remotely during the pandemic and disproportionately affected by the recent bout of inflation. The higher other assets indicator score, and to a lesser extent the homeownership indicator, has enabled wealthier households to offset the negative impact inflation is having on the value of pension indicator.
Fig. 2. Long-term financial resilience currently similar to pre-pandemic levels in aggregate but gap between low and high income households has widened
Outlook for the next 12 months clouded by the continued drag from mortgage refinancing
Looking ahead, despite a projected continued decline in headline inflation—supported by substantial declines in household energy bills—the outlook for household finances is gloomy. Our baseline forecast is for a continuous gradual decline in real household disposable income over the next 12 months. In addition, persistent upside surprises in core inflation readings mean we now expect interest rates to be higher than projected in January. This development will be particularly bad news for homeowners needing to refinance their mortgage over the next 12 months and any would-be first-time-buyers.
While many households will be able to cope with higher repayments, for some, the increase in monthly outgoings will be the source of significant financial stress. Using the barometer dataset, we identify the following three categories of households:
- ‘at risk’ – where there mortgage payments will be more than 25% of net household income
- ‘at high risk’: ‘at risk’ households who have less than three months of essential spending savings coverage.
- ‘at critical risk’: ‘high risk’ households which also currently have unsustainable levels of spending (outgoings being higher than incomings).
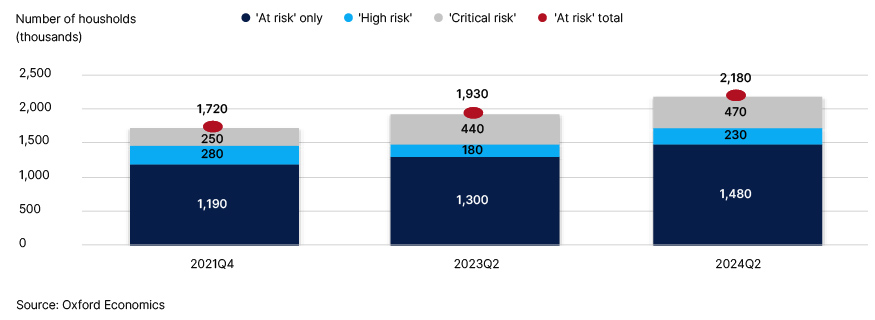
Fig. 3 charts the share of mortgage holding households that fall into each category over time. This clearly showcases how higher borrowing rates have contributed to a worrying trend increase in the likelihood that these owner-occupiers will be suffering from elevated levels of financial stress. Perhaps more notably, our forecasts suggest that the share of mortgage owners who are at ‘critical risk’ is set to reach 5.6% by 2024 Q2, nearly double the rate seen in 2021 Q4, when rates remained at their post-Global Financial Crisis normal level.
Consistent with findings reported in our February Refinancing note, mortgage-holding household cohorts that more likely to be at risk include single households, those where the primary earner was in part-time employment or self-employed and baby boomers.
Fig. 3. A high share of ‘at risk’ mortgage holders suffer from other forms of financial difficulties
Financial resilience – the current state of the nation
According to our flagship Barometer measure, there has been a further marginal deterioration in the state of the nation’s finances over the past six months, with the national average score dropping by 0.3 points to 60.8. This followed on from a year (2022) when a collection of economic headwinds—collectively described as the ‘cost of living crisis’—wiped out approximately a quarter of the aggregate boost to financial resilience that households enjoyed during the pandemic (Fig. 4). Despite this rather grim backdrop, things could have been much worse with large-scale government interventions providing vital support for many households over the winter.
Fig. 4. How National Financial Resilience has changed from pre-pandemic to 2023 Q2
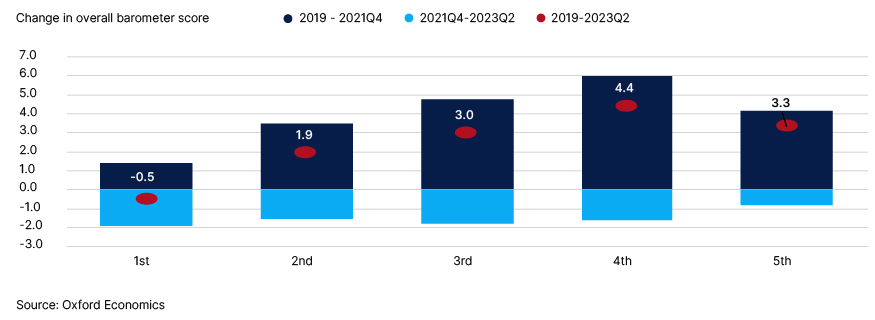
Limited pandemic gains for the poorest quintile wiped out
When combining the pillar scores, the overall picture looks particularly bleak for those in the lowest quintile. These households had limited opportunities to save during the pandemic when compared to wealthier households. This has left them financially vulnerable to the current economic challenges, causing debt anxiety to rise and some to fall behind on their payments. Combined with a deterioration in their long-run financial resilience, they are now worse off than before the pandemic.
Fig. 5. Limited pandemic gains for the poorer households have been wiped out
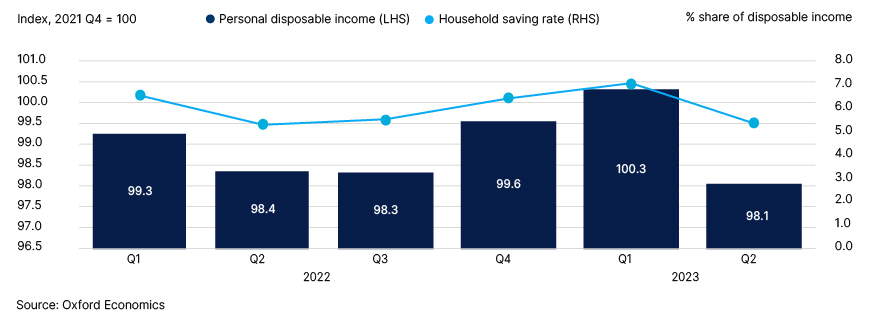
Government support provided significant help to households during the winter...
Despite the prevailing economic turbulence, household disposable income rebounded strongly in 2022 H2 supported by energy bill grants that were introduced in October covering the winter months. As displayed in Fig 6, this sustained an increase in the household savings ratio either side of the 2023 New Year. However, the withdrawal of this temporary support should lead to a significant decrease in (inflation adjusted) household disposable income during the second quarter of 2022, an outcome that would limit their ability to save and plan for the future.
Fig. 6. Second half of 2022 held up better than expected due to government support
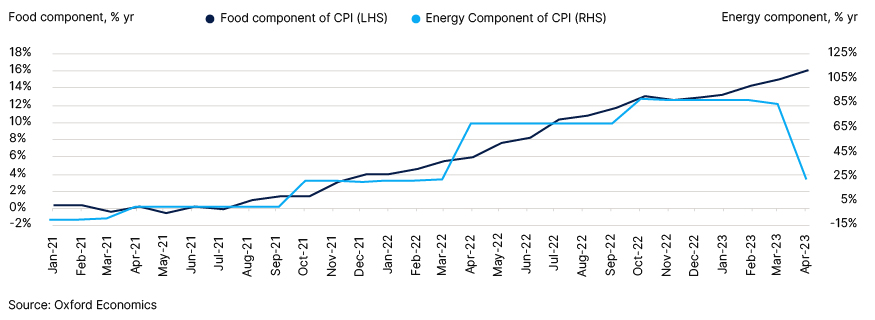
...however, many households face challenging times as inflationary pressures continue...
While energy prices have begun to fall—thus reducing total inflationary pressure on households— core inflation has become entrenched and food inflation has risen. Indeed, this upward trend in food inflation has now overtaken energy at the top of policymakers’ agendas, as shown by recent reports of Cabinet-level explorations of policies such as capping basic food prices.
Fig. 7. Food has overtaken energy as top of mind for policymakers
...that particularly impact those poorer households with fewer options to trade down...
As discussed in the January release, one concerning aspect of this inflationary period has been its disproportionately large impact on the price of non-discretionary items, for which households naturally have fewer viable options to cut back. It is also true that increases in the prices of these non-discretionary items create a proportionately larger squeeze on less affluent households who typically spend a higher fraction of their income on such ‘essentials’.
This pattern, in the case of food, is illustrated in Fig 8 drawing on data from the latest Living Costs and Food Survey (LCFS). It shows the proportion of household income spent on food categories, after dividing households into 5 groups based on their income. In general, the total length of the bars slopes downwards indicating that lower-income households spend a higher share of their income on food and beverage related expenditure categories.
Fig. 8. Spending shares on Food & Beverages by households, by income quintile: 2021 - 22
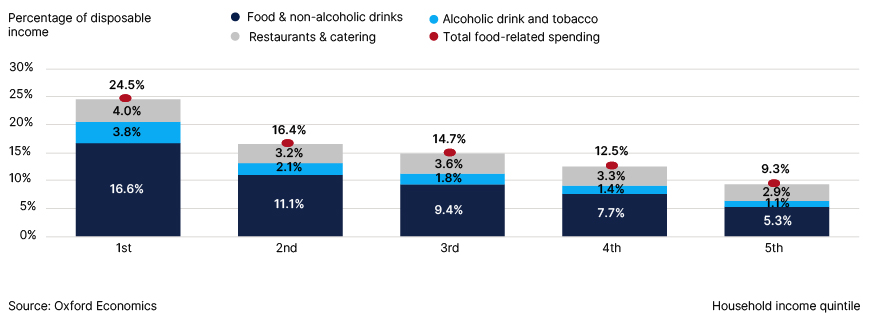
This type of analysis, however, understates the extent to which the recent surge in food prices will have had unequal effects across society. This is because higher-income households will have significantly more scope to cut back on spending by ‘trading down’. To some extent, this is apparent in the data displayed in Fig 8. For example, among the richest 20% of households over 30% of spending goes on, the typically more expensive option, eating out close to double the average share of the poorest 20%.
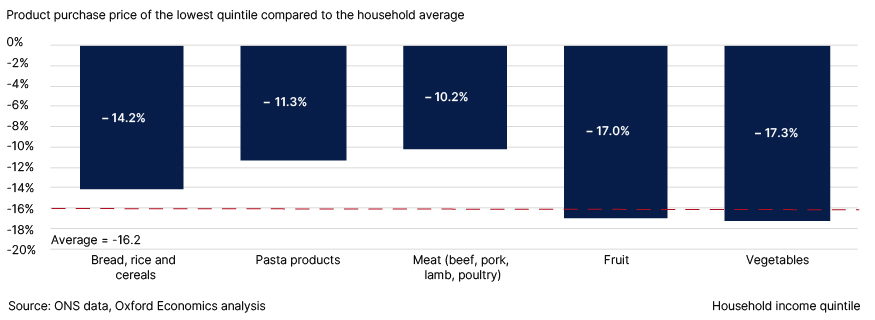
Moreover, less capacity to trade down is not limited to switching from eating out to cooking for yourself. Lowest income households are also much more likely to be purchasing lower price ‘basic’ products at the supermarket. Based on pre-pandemic data in the ‘Family Food’ report, the lowest quintile spends 16.2% less than the average household across the essential products (Fig. 9). As displayed, this pattern was replicated across a range of essential items with fruit and vegetable products showing the largest differentials. By implication, poorer households typically have less scope to trade down to lower-priced ranges leaving them with difficult choices of how to make ends meet.
Fig. 9. Low-income households spend considerably less per capita on basic retail items indicating less scope to trade down in the face of rampant supermarket inflation
...which has led to a concentrated spike in arrears and debt anxiety
In the last edition, we highlighted the uneven impact of recent economic challenges on short-term financial resilience through the ‘save a penny for a rainy day’ pillar scores in the Barometer. Subsequently released data shines light on how this has fed through to developments in household liabilities, as measured by a range of indicators in the ‘control your debt’ pillar of the Barometer.
Overall, our modelling suggests 10.4% of households were in arrears in 2023 Q2, representing an increase of 600,000 households when compared to the pre-pandemic level. This has been underpinned by an increase in the number of households falling behind with their utility bills rather than loans, even after the support the government provided. Indeed, 2022 data from Ofgem show just over 30% more households are in arrears on their energy bills when compared to 2021 and close to 50% higher than pre-pandemic levels in 2019.
Those households falling behind with their payments have been concentrated among low income and non-working households. These trends, within the framework, of the Barometer are starkly brought to life in Fig 10, with our latest estimate for the average ‘arrears’ indicator score for low income households and non-working households significantly lower than in 2019 compared to the average decline. Furthermore, renters and households with children have seen a larger than average fall in their ‘arrears’ indicator with 1 in 5 renting households now expected to be in arrears and close to 1 in 6 for families with children.
The human toll of this higher incidence of falling behind on debt payments is, of course, increased anxiety and stress. This manifests numerically in the Barometer through commensurate trends in the ‘subjective evaluation of debt position’ indicator.
Fig. 10. ‘Cost of living’ crisis has led to a spike in arrears and consequent debt anxiety for many households

Trends in long term financial resilience strongly linked to household income
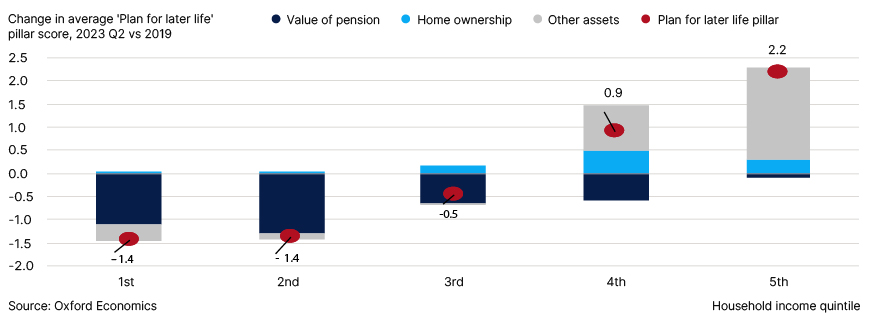
Moreover, data in the Barometer highlights that this pattern has also been apparent in indicators linked to long-term financial planning in the ‘plan for later life’ pillar. Overall, long-term resilience across the nation today is virtually unchanged compared to its pre-pandemic level according to the barometer. Within our framework, there has been a been 1.3 points fall in the ‘pension value’ indicator with increased contributions and asset price growth insufficient to offset the impact of rapid inflation. At a national level, this has been offset by improvements in households’ financial position in terms of other (non-pension) assets.
However, as shown in Fig 11, this overall stability masked a very uneven pattern across the nation with lower income households, again, faring far worse-than-average, a trend that will have exacerbated inequality in long-term financial resilience. The driver of this shift has been the variation in changes in savings rates since 2019 with low income households less likely to work remotely during the pandemic and, as described in this note, disproportionately affected by the recent bout of inflation.
Fig. 11. Long-term financial resilience currently similar to pre-pandemic levels in aggregate but gap between low and high income households has widened
Despite falling back recently, the financial resilience of households who are employed by the public sector remains relatively high underpinned by their plan for later life pillar
The level of financial resilience among public sector workers remained relatively unchanged during the pandemic when compared to their private sector counterparts. However, the situation has shifted since the end of the pandemic. Specifically, public sector earnings in 2022 have failed to keep pace with both inflation and private sector earnings, resulting in numerous national strikes. The impact of this can be seen in the short-run indicators, surplus income, and adequacy of liquid assets which fell in comparison to those working in the private sector.
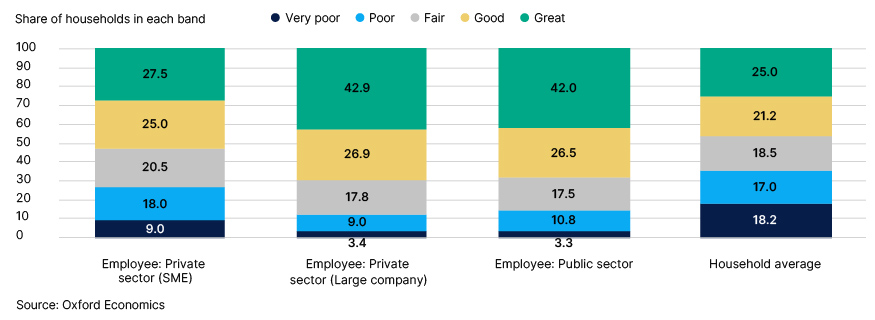
Despite this, employees working for the public sector still had a high level of financial resilience by the end of 2022. Indeed, just over two out of three are categorised as having great or good financial resilience. On the other hand, households working for SMEs have a significantly lower proportion in these categories. As those working for large private sector companies have similar scores to the public sector, it highlights the financial support larger organisations provide to their employees that is not available for those working for an SME.
Fig. 12. Distribution of Barometer category by employer type and employment status: 2022 Q4
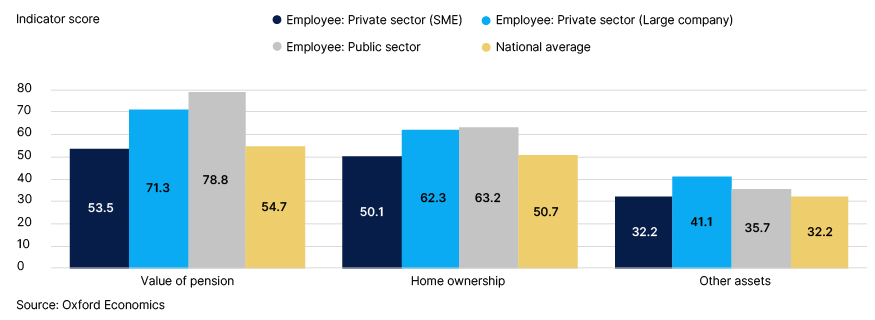
The ‘Plan for later life’ pillar underpins a large proportion of this difference. In particular, the value of the pension indicator is significantly higher for those working for a larger organisation (both private and public) compared to an SME. Higher home ownership and other assets score further exacerbate the difference causing the SME ‘Plan for later life’ pillar to be 14.2 points lower than an employee working for a large private company and 16.8 points lower than those employees working in the public sector. With the current environment putting pressure on the long-term financial resilience of households, closing the pension gap between SME and larger organisations can help reduce the vulnerability of their employees upon retirement.
Fig. 13. Those working for larger organisations have better pension provisions
Outlook for the next 12 months
Prospects for the next 12 months remain grim for the UK consumer
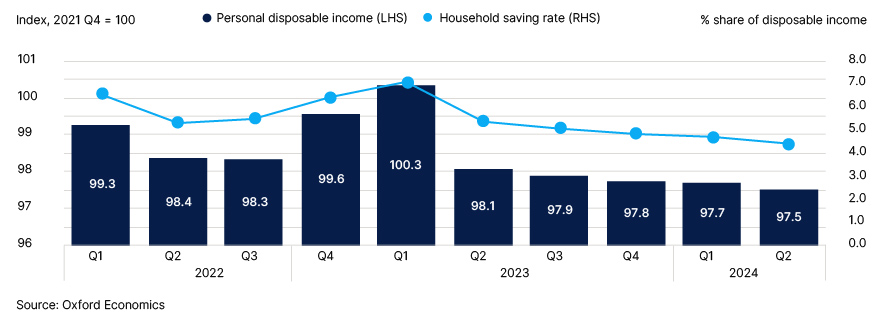
Looking ahead, despite a projected continued decline in headline inflation—supported by substantial declines in household energy bills—the outlook for household finances is gloomy. Our baseline forecast is for a continuous gradual decline in real household disposable income over the next 12 months with additional labour market slack and the drag from the decision to freeze tax thresholds in the most recent budget combining to squeeze purchasing power. As displayed in Fig. 14, our forecast is for real disposable income to end 2024 Q2 2.5% lower than the end of the pandemic (2021 Q4), a trend that will cause a gradual reduction in the ability of households to save, with the savings rate expected to fall to 4.4%.
Fig. 14. Household disposable income will continue to decline limiting the ability of households to save
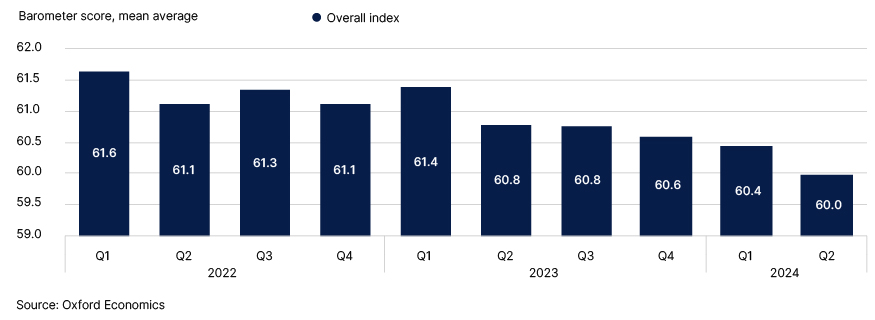
Reflecting this challenging environment, our forecast is for a sustained steady reduction in the national average barometer score over the next 12 months (Fig. 15). Within the framework of the barometer, the decline is set to be broad-based with pressures on disposable income likely to erode both short-term resilience as measured by the ‘rainy day savings’ pillar and the relative preparedness of households for retirement as measured by the ‘plan for later life’ pillar.
Fig. 15. Macroeconomic headwinds to drive a sustained decline in financial resilience across the nation
More than one-in-four households projected to be under severe financial strain pointing to further challenges for debt management...
With no signs of improvement on the horizon, the proportion of households with unsustainable spending is expected to remain elevated. By the end of 2022 Q4 this had risen to 26.1% and our forecast is for this share to remain very stable through to 2024 Q2, more than double its pre-pandemic level (11.7%).
Households facing this dynamic can adapt through the following three ways: cutting back what they buy i.e., reducing their real level of consumption; drawing down on existing assets; and taking on more debt. Indeed, many households are likely to have reacted through a mix of these behavioural changes.
For policymakers, it is this third response—taking on more debt—that is likely to be top of mind. With income growth expected to lag headline inflation for the foreseeable there is a growing risk of vulnerable households running into adverse debt spirals. Moreover, as noted in the previous section, the incidence of arrears appears to be already on the rise and to be highly concentrated among low-income households (Fig. 9).
...with low income households disproportionately likely to be at high risk
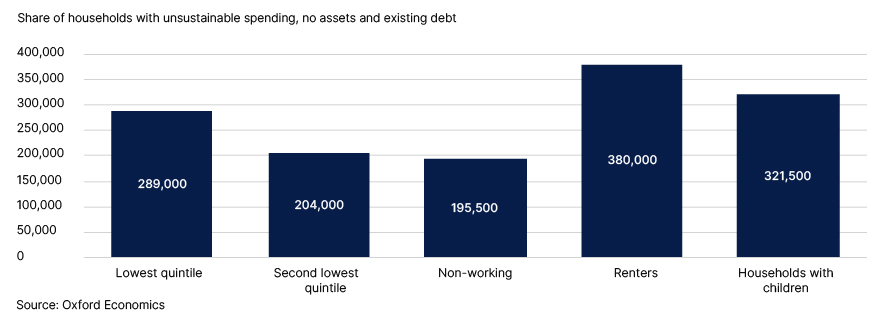
Within the barometer, we can zone in on those that are most ‘at risk’ by identifying the share of households with unsustainable spending, who have no assets to draw down from and already have some form of existing liabilities. At the national level, our modelling suggests that this will account for a small minority of households over the next 12 months—approximately 3.2% of the total representing 630,000 households.
Unsurprisingly, as shown in Fig. 16, these ‘at risk’ households are significantly more likely to be low income. Indeed, our modelling shows that more than one-in-ten of households in the lowest income quintile are at high risk of falling behind on their debt, more than three times the national average rate. It is worth noting, however, that this share is materially lower than six months ago (then 14%) a reflection of the substantial beneficial impact of the government’s interventions over the winter that limited the impact of higher energy prices on households’ budgets. Those at risk also include many renters and households with children representing 5.2% and 5.0% of their cohort respectively.
Fig. 16. Poorer households are the most at risk of falling behind with debt payments
Mortgage costs continue to rise...
Persistently higher core inflation is forecast to force the Bank of England to keep raising interest rates, and to hold them higher for longer than expected. Indeed, we now expect interest rates to be higher than projected in January with the Bank of England hiking rates to 5% at their June meeting. Our current view is that rates will continue to rise, peaking at 5.75%1.
As discussed in the January edition, the mortgage market has shifted heavily towards fixed-rate packages since the financial crisis. As a result, the impact of the very significant monetary tightening that has taken place over the past nine months will only feed in with a considerable lag although those unfortunate enough to have refinanced in the interim period now face much higher borrowing costs which will have added to the already considerable challenges presented by the ‘cost of living’ crisis.
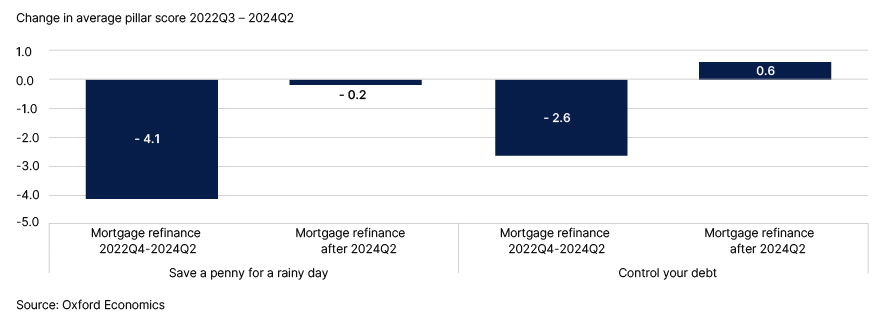
The impact of this ‘mortgage lottery’ can be gauged through the barometer by comparing the change in scores of households depending on their refinancing point (Fig. 17). As shown, homeowners that refinance between 2022 Q4 and 2024 Q2 are found to suffer from substantial average falls in both the ‘save a penny for a rainy day’ and ‘control your debt’ pillar scores where other homeowners with a mortgage will see their pillar scores broadly stabilise, on average. By 2023 Q2, 1 in 3 mortgage holders have already faced higher mortgage costs. As more households refinance over the next 12 months, this will rise to 3 in 5 mortgage holders with higher mortgage costs by the end of 2024 Q2.
1The modelling was underpinned by a baseline forecast which assumes interest rates would peak at 5%. Therefore, projections related to financial stress for mortgage holders are likely to be conservative.
Fig. 17. The fall in short-term resilience is expected to increase for mortgage holders having to refinance
...increasing the number of vulnerable mortgage-holding households
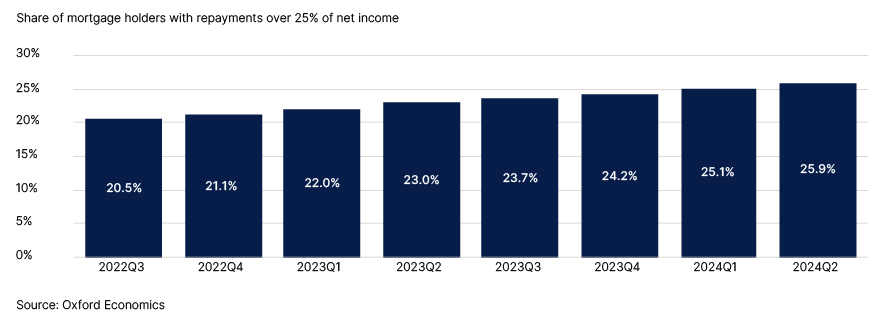
For some households, such an increase in essential outgoings will represent much more than an inconvenience and create a high level of financial stress. In line with the Hargreaves Lansdown February refinancing report2, we have identified households as ‘at risk’ when their payments are expected to exceed 25% of the household’s net (after tax) income. As shown in Fig. 18, the proportion of ‘at risk’ households are expected to rise over the next 12 months to 25.9% as more households are required to refinance their mortgages. While there has been a modest improvement in the proportion in comparison to the February refinancing report (2023 Q4 was 25.7%), this is underpinned by an improvement in the income projections while mortgage costs are expected to be higher.
2At risk mortgage holders supplement
Fig. 18. Proportion of households with high mortgage payments rise as more refinance
The virtue of the barometer, however, is that it offers a much more holistic metric enabling us to move beyond this type of relatively crude measure by factoring in other aspects of an individual household’s financial position. Specifically, in this section, we use the data to develop the following categorisations:
- High risk: households with inadequate cash savings—less than three months of essential spending.
- Critical risk: At-risk households who combine inadequate savings with current unsustainable spending.
As shown in Fig. 19 one in three have cash savings that cover less than three months of essential spending and one in five also have unsustainable spending. By 2024 Q2, there are 230,000 households that are at high risk and 470,000 households that are at critical risk. The number of households in critical risk has seen a particularly large increase when compared to 2021 Q4, with 220,000 more households within this group.
Fig. 19. Unsustainable spending and lower savings raise the prospect of being a financially ‘at risk’ household by 2024 Q2

Younger households are the most vulnerable to a crash in asset and house prices
Our baseline forecast, therefore, paints a broadly pessimistic picture with no expectation that recent economic headwinds will recede any time soon. Nevertheless, further downside risks abound, and, in this section, we analyse the impact of a severe crash in global assets prices, through the lens of a simulation created as part of Oxford’s quarterly Global Scenarios Service.
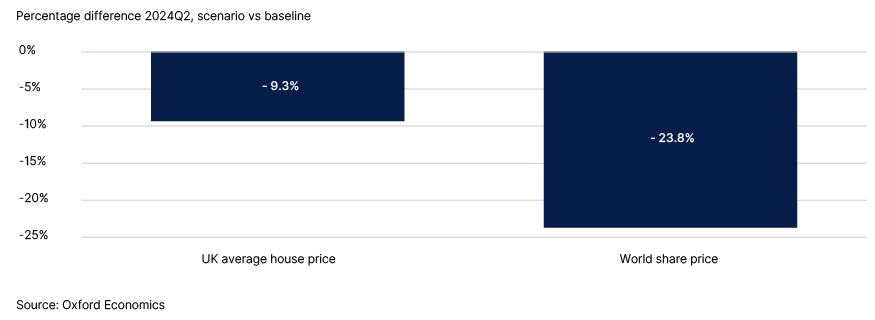
In this scenario, higher interest rates are assumed to trigger sharp falls in stock markets and house prices, tighter credit conditions, and declines in consumer spending and investment. As a result, by 2024 Q2, average UK house prices are 9.3% lower and global asset prices 23.8% lower when compared to the baseline forecast (Fig. 20).
Fig. 20. Asset prices see a sharp decline and household prices fall
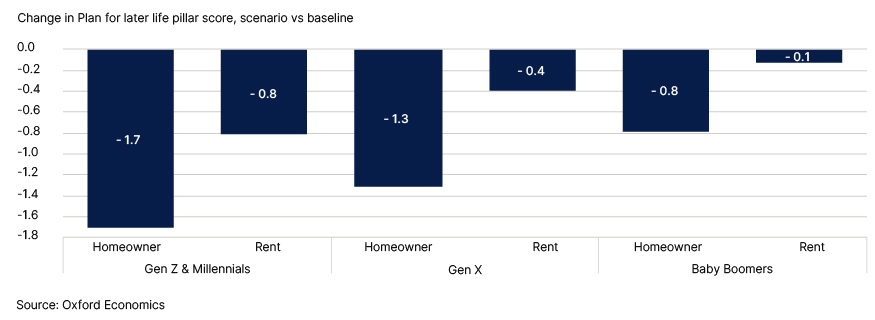
Were this scenario to pan out, it would have a particularly detrimental impact on the ‘Plan for later life’ pillar, as home equity and pension values that are linked to global stock markets are hit. While homeowners will be hit the hardest seeing their ‘Plan for later life’ pillar score fall by 1.4 points, renters will also be impacted with their score declining by 0.6 points. The severity of the impact differs when we look at it by generation. Younger homeowners and renters are expected to see a much larger fall than their older counterparts. Mortgage debt is generally higher among younger homeowners, making them more vulnerable to the effects of market value fluctuations. On the pension side, older households are typically less exposed to stock prices. This includes holding more government bonds, which provide higher returns in this scenario, and having a higher proportion of their pension wealth in types of pensions not directly exposed to the stock market. In addition, the required pension threshold has a steeper rise in the early years as it takes into account the higher wage growth expected at the start of a worker’s career. A scenario, therefore, that hampers an increase in younger households’ pension accumulation will have a disproportionately larger effect when compared to the pension requirement threshold.
Fig. 21. Both younger renting and homeowner households are hit the most
Key statistics from the Barometer: variation in financial resilience accross the nation
Financial resilience is closely correlated with income, age, employment status and household composition. Ultimately every household’s financial position will reflect a mixture of their socioeconomic position, composition and decisions that they take on how to use their income. These charts help to illustrate how the variation that does exist is associated with various indicators that relate to these factors.
Household Income
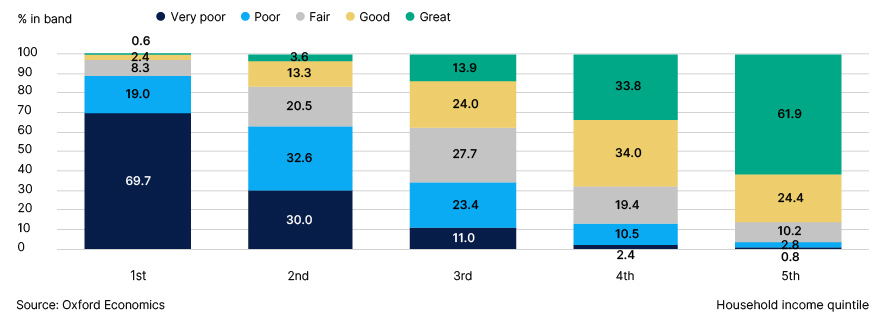
Fig. 22 shows how closely financial resilience is correlated to household income, with almost symmetric results between the lowest and highest income quintiles:
- 89% of the lowest income quintile have poor or very poor levels of financial resilience, while around 86% of the highest income quantile have good or great levels of financial resilience.
- Around two thirds of the second income quintile have poor or very poor levels of financial resilience, while just over two thirds of the fourth income quantiles have good or great levels of financial resilience.
- This leaves around a third of the middle-income quintile with poor or very poor levels of financial resilience. These households on middle incomes would typically have the means to build their financial resilience but many are struggling to do so at present due to the ‘cost of living’ crisis.
Fig. 22. Distribution of Barometer category scores by household income quintile (Q4 2022)
Household Family Type
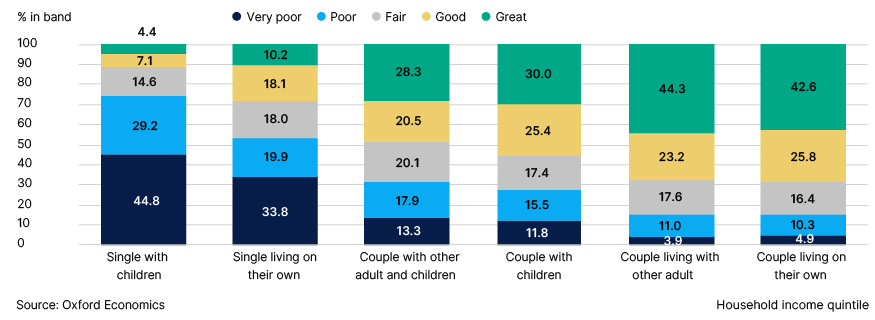
Fig. 23 provides a clear demonstration for how sharing a household with other adults, be it as part of a couple of or another adult, is strongly correlated with higher levels of financial resilience. Partly this will be the effect of additional incomes in the household, partly it will be the sharing of costs but there may be additional assistance to manage financial administration to ensure all financial commitments are met and plans for the future can be made.
Fig. 23. Distribution of Barometer category scores by household family type (Q4 2022)
Age
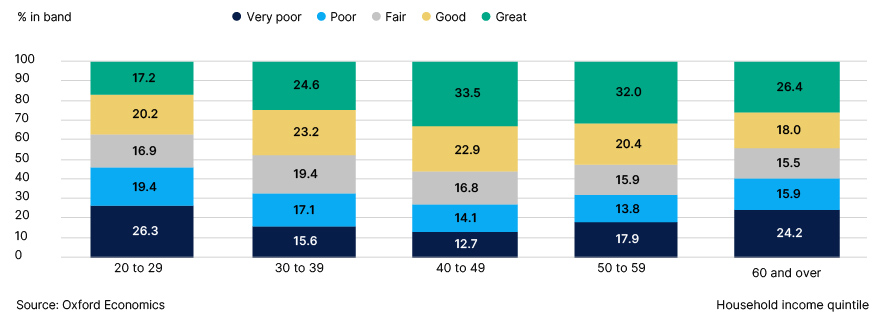
Fig. 24 shows how financial resilience is typically highest amongst households where the primary income earner is aged between 40 and 49. Some of this effect may be a result of peak earnings, while some family costs may begin to reduce. Additionally, increasing proximity to retirement may result in additional planning for retirement.
Fig. 24. Distribution of Barometer category by age of household reference person (Q4 2022)
Employment
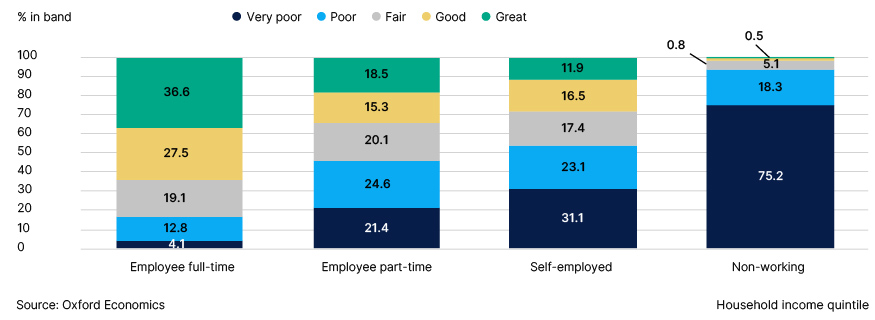
Fig. 25 shows very clearly how employment is an important predictor of financial resilience. The employment status of a household is determined by the employment status of the main earner. Notably, part-time employees and the self-employed appear to have very similar levels of financial resilience, suggesting that the loss of income from working part-time has a similar effect to the reduction in support from working from an employer who may be able to provide financial benefits, such as a workplace pension. Unsurprisingly, those who are not working are extremely likely to suffer from low levels of financial resilience.
Fig. 25. Distribution of Barometer category by household employment status (Q4 2022)
About the barometer
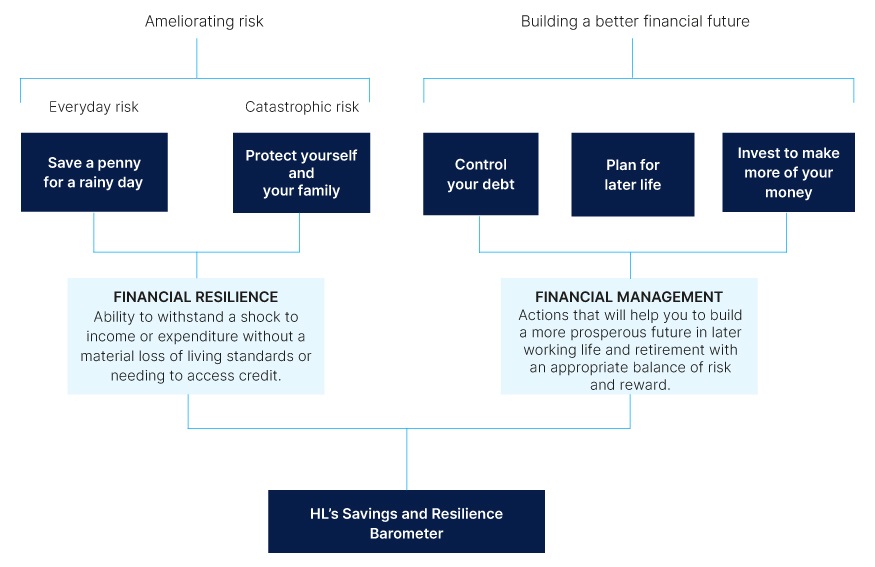
The savings and financial resilience barometer is an index measure designed and produced by Oxford Economics. It is based around Hargreaves Lansdown’s five building blocks for financial resilience depicted in Fig. 26. The aim of the barometer is to provide a holistic measure of the state of the nation’s finances, monitoring to what extent households are prudently balancing current and future demands whilst guarding against alternative types of risk.
Fig. 26. Savings and Resilience Barometer: conceptual structure
In collaboration with Hargreaves Lansdown, Oxford Economics mapped each of these pillars to a list of 16 individual indicators (Fig. 27). For the July 2023 release, there has been a methodological change to the (formally known) ‘Protect your family pillar’. We now include households who don’t have dependants for critical illness, sick pay and balance of earnings. Life insurance coverage remains only for households with dependants. This updated pillar will now be called ‘Protect yourself and your family’. A single household now takes the value zero for the balance of earnings indicator. The Sick pay and critical illness indicator will be based on household characteristics.
The data underpinning the indicators is sourced a household panel dataset for a representative group of British households developed by linking together official datasets. The Wealth and Assets Survey (WAS), published by the ONS, has been used as the core dataset due to the breadth of financial data available in the survey. This source does not include every variable required to measure the factors and the latest survey only extends as far as 2020 Q1. Therefore, we have used a range of methods including econometric analysis to build upon the core dataset using data from the Financial Lives Survey (FLS), Living Costs and Food Survey (LCFS) and the Labour Force Survey (LFS).
For each indicator, the data was used to create an index value on a scale of between zero and 100 for households in the panel. In each case, a score of 100 was assigned to households who had reached a specified resilience threshold e.g., holding liquid assets equivalent to at least three months of essential expenditure. Households whose savings are sufficient to cover more than three months of spending are, therefore, not rewarded for this additional level of security. Such a design is appropriate to capture the concept of resilience and the intrinsic trade-offs involved in financial management. Threshold values are defined with reference to benchmark recommendations where available and, where not, using the statistical distribution of values within the dataset and the judgement of the research working group.
Fig. 27. Savings and Resilience Barometer: Barometer Indicators
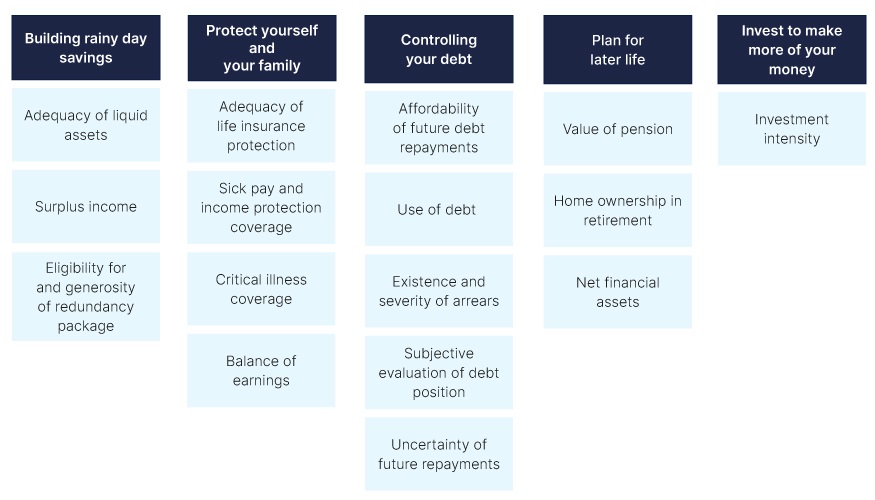
To bring dataset up to date, values have been extrapolated through to 2022 Q4 using a wide range of macroeconomic and survey data and different modelling techniques. A much more detailed description of the approach can be found in the methodology report available on the project’s landing page3. Finally, current and future values are projected based on Oxford Economics’ baseline forecast for the UK economy from its Global Economic Model (GEM).
To aid the communication of the barometer results, we have designed a method to allocate households between five bands according to their barometer scores. These bands are labelled as: very poor, poor, fair, good and great. We will use the share of households in each band as a reference point to communicate the changing state of financial resilience in the UK.
The bands are primarily based on the quintile distribution of pre-pandemic barometer scores. The pre-pandemic distribution of ‘Control your debt’, ‘Invest to make more of your money’ and to a lesser extent ‘Protect Yourself and Your Family’ have been adjusted to take account of the nonlinear distribution of scores. Threshold scores for each band are fixed to values observed in the pre-pandemic (2019) period so that changes in the shares can be used to trace developments over time.
3https://www.hl.co.uk/features/5-to-thrive/savings-and-resilience-comparison-tool
Fig. 28. Score range and pre-pandemic (2018 Q1-2020 Q1) proportion of households
Score range |
||||||
|---|---|---|---|---|---|---|
| Band | Save a penny for a rainy day |
Protect Yourself and Your Family |
Control Your Debt |
Plan for Later Life |
Invest | Overall Index |
| Very poor | 0-28 | 0-42 | 0-54 | 0-8 | 0 | 0-42 |
| Poor | 28-50 | 42-67 | 54-66 | 8-36 | 1-19 | 42-55 |
| Fair | 50-72 | 67-76 | 66-78 | 36-61 | 19-52 | 55-65 |
| Good | 72-89 | 76-88 | 78-95 | 61-79 | 52-82 | 65-74 |
| Great | 89-100 | 88-100 | 95-100 | 79-100 | 82-100 | 74-100 |
Pre-pandemic proportion of households |
||||||
|---|---|---|---|---|---|---|
| Band | Save a penny for a rainy day |
Protect Yourself and Your Family |
Control Your Debt |
Plan for Later Life |
Invest | Overall Index |
| Very poor | 20 | 17 | 19 | 20 | 55 | 20 |
| Poor | 20 | 18 | 19 | 20 | 11 | 20 |
| Fair | 20 | 26 | 19 | 20 | 11 | 20 |
| Good | 20 | 20 | 19 | 20 | 11 | 20 |
| Great | 20 | 20 | 25 | 20 | 11 | 20 |
ABOUT OXFORD ECONOMICS
Oxford Economics was founded in 1981 as a commercial venture with Oxford University’s business college to provide economic forecasting and modelling to UK companies and financial institutions expanding abroad. Since then, we have become one of the world’s foremost independent global advisory firms, providing reports, forecasts and analytical tools on more than 200 countries, 100 industries, and 7,000 cities and regions. Our best-in-class global economic and industry models and analytical tools give us an unparalleled ability to forecast external market trends and assess their economic, social and business impact.
Headquartered in Oxford, England, with regional centres in New York, London, Frankfurt, and Singapore, Oxford Economics has offices across the globe in Belfast, Boston, Cape Town, Chicago, Dubai, Dublin, Hong Kong, Los Angeles, Mexico City, Milan, Paris, Philadelphia, Stockholm, Sydney, Tokyo, and Toronto. We employ 450 staff, including more than 300 professional economists, industry experts, and business editors—one of the largest teams of macroeconomists and thought leadership specialists. Our global team is highly skilled in a full range of research techniques and thought leadership capabilities from econometric modelling, scenario framing, and economic impact analysis to market surveys, case studies, expert panels, and web analytics.
Oxford Economics is a key adviser to corporate, financial and government decision-makers and thought leaders. Our worldwide client base now comprises over 2,000 international organisations, including leading multinational companies and financial institutions; key government bodies and trade associations; and top universities, consultancies, and think tanks.
July 2023
All data shown in tables and charts are Oxford Economics’ own data, except where otherwise stated and cited in footnotes, and are copyright © Oxford Economics Ltd.
The modelling and results presented here are based on information provided by third parties, upon which Oxford Economics has relied in producing its report and forecasts in good faith. Any subsequent revision or update of those data will affect the assessments and projections shown.
To discuss the report further please contact:
Henry Worthington:hworthington@oxfordeconomics.com
Oxford Economics
4 Millbank, London SW1P 3JA, UK
Tel: +44 203 910 8061