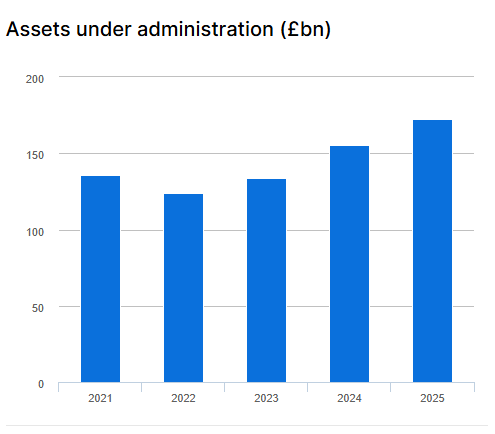
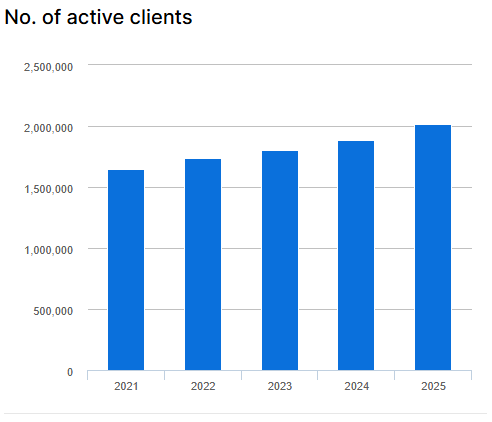
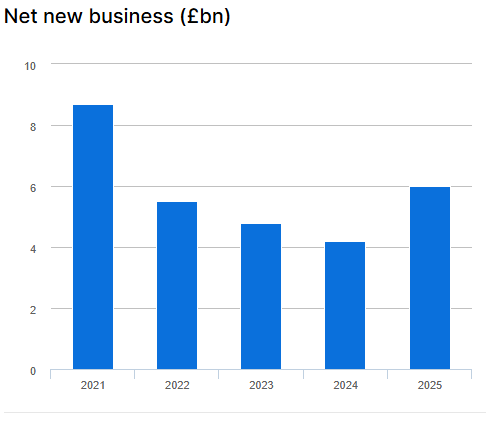
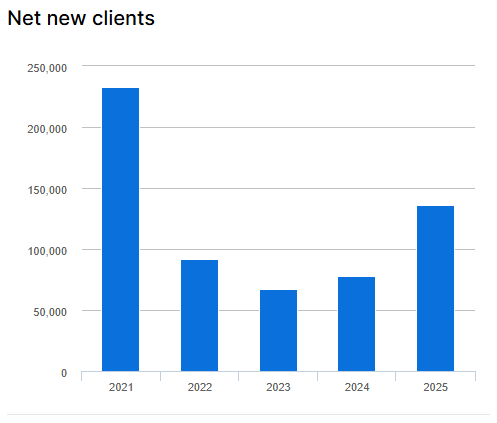
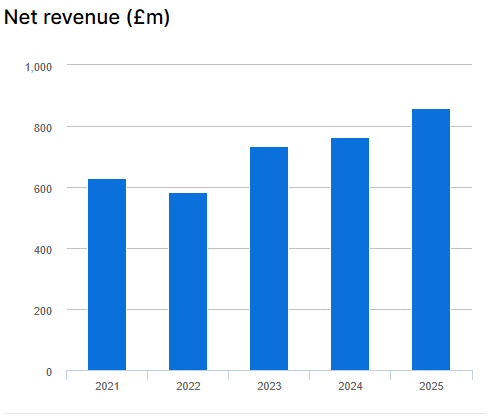
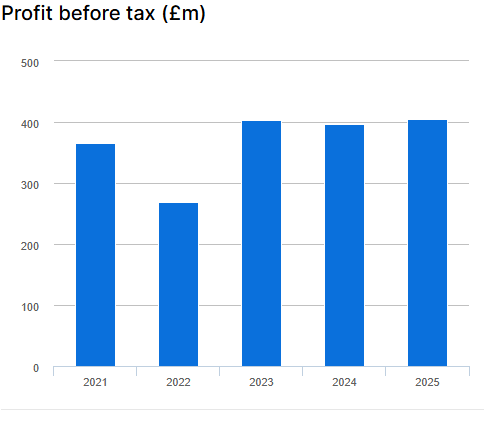
Key financial data
Our diversified business model continues to support clients in reaching good outcomes and has delivered robust financial performance, with year-on-year revenue growth of 26% and increasing both underlying and statutory profit by around 50%.
Whilst a challenging market backdrop and the ongoing cost-of-living crisis has constrained platform flows and dealing volumes, clients have benefitted from our diversified platform, with Active Savings flows at a record £3.2bn.
We welcomed a further 67,000 net new clients to our service over the period taking our total client numbers to over 1.8 million, with client retention increasing during the period to 92.2%. Our focus remains on engaging with clients and helping them to navigate the challenging backdrop.
The progress we have made over this period is thanks to the work of our colleagues and their focus on supporting our clients."

Hargreaves Lansdown in numbers
We are a well-established and trusted brand, providing a high-quality service across a range of products and services.
1,239,000+
ISAs517,000+
Fund and Share Accounts542,000+
SIPP accounts including SIPP Income Drawdown£53 billion+
ISA AUA£30 billion+
Fund and Share Account AUA£42 billion+
SIPP AUA123,000+
Lifetime ISA clients172,000+
Junior ISAs176,000+
Corporate scheme members£2.2 billion+
Portfolio Management Service AUA£8.7 billion+
HL Fund Manager AUM£7.8 billion+
Active Savings AUA516
Corporate schemes41.8%
Platforum UK D2C market shareThe following graphs provide a five year trend of our key financial data:
Assets under administration (£bn)
No. of active clients
Net new business (£bn)
Net new clients
Net revenue (£m)
Profit before tax (£m)
Diluted earnings per share (pence)
Dividend per share (pence)
Year ended 30 June 2019 |
Year ended 30 June 2020 |
Year ended 30 June 2021 |
Year ended 30 June 2022 |
Year ended 30 June 2023 |
|
---|---|---|---|---|---|
£m | £m | £m | £m | £m | |
Revenue | 480.5 | 550.9 | 631.0 | 583.0 | 735.1 |
Fair value gains on derivatives | 2.2 | 1.7 | 0.6 | - | - |
Operating costs | (179.4) | (214.9) | (266.0) | (313.0) | (350.7) |
Operating profit | 303.3 | 337.7 | 365.6 | 270.0 | 384.4 |
Finance income | 2.8 | 2.8 | 1.4 | - | 19.0 |
Finance costs | (0.3) | (1.0) | (1.0) | (0.8) | (0.7) |
Other gains | - | 38.8 | - | - | - |
Profit before tax | 305.8 | 378.3 | 366.0 | 269.2 | 402.7 |
Tax | (58.2) | (65.1) | (69.7) | (53.4) | (79.0) |
Profit after tax | 247.6 | 313.2 | 296.3 | 215.8 | 323.7 |
Non-controlling interests | 0.2 | 0.1 | (0.4) | (0.5) | 0.1 |
Profit for the financial year attributable to owners of the parent company | 247.4 | 313.1 | 296.7 | 216.3 | 323.6 |
The above figures may be subject to roundings.
At 30 June 2019 |
At 30 June 2020 |
At 30 June 2021 |
At 30 June 2022 |
At 30 June 2023 |
|
---|---|---|---|---|---|
£m | £m | £m | £m | £m | |
Non-current assets | |||||
Goodwill | 1.3 | 1.3 | 1.3 | 1.3 | 1.3 |
Other intangible assets | 23.0 | 28.0 | 33.6 | 37.3 | 50.4 |
Property, plant and equipment | 16.0 | 33.2 | 28.6 | 22.5 | 17.4 |
Deferred tax assets | 3.8 | 3.1 | 3.7 | 1.9 | 2.6 |
37.3 | 44.1 | 65.6 | 67.2 | 71.7 | |
Current assets | |||||
Trade and other receivables | 748.6 | 973.2 | 869.2 | 523.5 | 836.9 |
Cash and cash equivalents | 179.3 | 235.9 | 445.3 | 488.3 | 373.3 |
Investments | 1.1 | 0.6 | 0.9 | 0.8 | 0.5 |
Derivative financial instruments | 0.1 | 0.1 | - | - | |
Current tax assets | - | 0.7 | 1.5 | 0.6 | 3.4 |
Total assets | 973.2 | 1,276.1 | 1,384.1 | 1,076.2 | 1,285.8 |
LIABILITIES | |||||
Current liabilities | |||||
Trade and other payables | 485.7 | 696.7 | 774.0 | 488.3 | 565.5 |
Derivative financial instruments | - | 0.1 | - | - | - |
Current tax liabilities | 27.5 | - | - | - | - |
513.2 | 696.8 | 774.0 | 448.3 | 565.5 | |
Net current assets | 415.9 | 513.7 | 542.9 | 524.9 | 648.6 |
Non-current liabilities | |||||
Provisions | 0.7 | 0.8 | 2.7 | 2.6 | 3.0 |
Non-current financial liabilities | - | 1.0 | - | - | - |
Non-current lease liabilities | - | 19.9 | 15.0 | 11.8 | 7.6 |
Total liabilities | 513.9 | 718.5 | 791.7 | 502.7 | 576.1 |
Net assets | 459.3 | 557.6 | 592.4 | 573.5 | 709.7 |
EQUITY | |||||
Share capital | 1.9 | 1.9 | 1.9 | 1.9 | 1.9 |
Shares held by Employee Benefit Trust | (3.4) | (6.3) | (4.8) | (3.6) | (6.4) |
EBT reserve | 1.5 | (1.9) | (3.1) | (2.4) | (1.0) |
Retained earnings | 457.9 | 564.6 | 599.5 | 579.2 | 715.2 |
Total equity attributable to the owners of the parent | 457.9 | 558.3 | 593.5 | 575.1 | 709.7 |
Non-controlling interest | 1.4 | (0.7) | (1.1) | (1.6) | - |
Total equity | 459.3 | 557.6 | 592.4 | 573.5 | 709.7 |
The above figures may be subject to roundings.
Year ended 30 June 2019 |
Year ended 30 June 2020 |
Year ended 30 June 2021 |
Year ended 30 June 2022 |
Year ended 30 June 2023 |
|
---|---|---|---|---|---|
£m | £m | £m | £m | £m | |
Net cash generated from operating activities | 261.5 | 265.4 | 328.6 | 262.9 | 215.3 |
(Increase)/Decrease in term deposits | (7.0) | (15.0) | 170.0 | 40.0 | (110.0) |
Proceeds/(purchase) on disposal of investments | 0.4 | 0.5 | (0.3) | 0.1 | 0.3 |
Proceeds/(purchase) on disposal of subsidiary | - | 38.2 | 0.2 | - | - |
Purchases of property, plant and equipment | (7.6) | (5.8) | (5.4) | (2.8) | (3.5) |
Cash capitalisation of intangible assets | (9.5) | (10.1) | (12.8) | (10.9) | (19.2) |
Net cash from/(used in) investing activities | (9.7) | 7.8 | 151.7 | 26.4 | 132.4 |
Financing activities | |||||
Purchases of own shares in EBT | (15.0) | (14.8) | (7.7) | (4.2) | (5.0) |
Proceeds on sale of own shares in EBT | 7.7 | 5.8 | 4.3 | 2.8 | 2.2 |
Payment of principal in relation to lease liabilities | - | (4.3) | (4.0) | (3.9) | (4.7) |
Dividends paid to owners of the parent | (190.5) | (103.3) | (263.5) | (241.0) | (190.4) |
Net cash (used in) financing activities | (197.8) | (216.6) | (270.9) | (246.3) | (197.9) |
Net increase/(decrease) in cash and cash equivalents | 54.0 | 56.6 | 209.4 | 43.0 | (115.0) |
Cash and cash equivalents at beginning of year | 125.3 | 179.3 | 235.9 | 445.3 | 488.3 |
Cash and cash equivalents at end of year (including restricted cash) | 179.3 | 235.9 | 445.3 | 488.3 | 373.3 |
The above figures may be subject to roundings.