
5 to Thrive
The key pillars for financial resilience
Life may be unpredictable, but we can take steps to secure our financial future. Financial resilience is key to weathering any storm. Many of us are unsure how resilient our finances are or how we compare to others.
That’s why we’ve partnered with Oxford Economics to create a unique index that measures the nation’s financial resilience across our 5 to Thrive pillars.
How financially resilient is the UK today?
Financial resilience has hit a Goldilocks phase – not as hot as the pandemic peak, but not as tepid as before the crisis either.
However, the way we’ve built resilience hasn’t been consistent. Some households are struggling, and for lots it’s uneven – with strengths in some areas and shortfalls elsewhere.
This snapshot comes from the latest edition of the HL Savings & Resilience Report, developed in partnership with Oxford Economics, to track the nation’s financial health.
Why some households feel better off
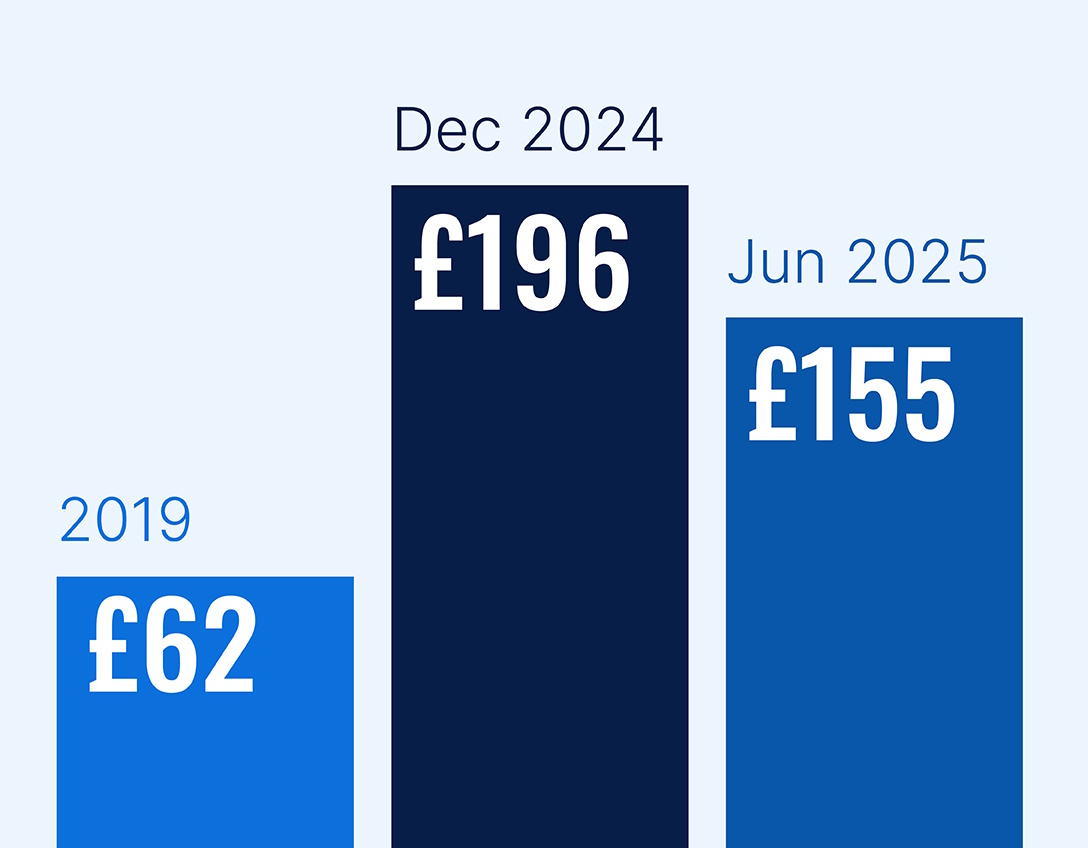
The amount of money people have after tax and inflation was up 1.6% in a year. The average household has £155 left at the end of the month – more than twice the pre-pandemic level.
They’re saving slightly more too – more than half now have enough emergency savings (52%). The average household has enough savings to cover 3.3 months’ worth of essentials – up by a full month since before the pandemic.
How much cash should you hold?
The debt position has also improved as more households have paid off borrowing, while others have shifted to the certainty of fixed rate mortgages.
It marks a steady improvement in short-term resilience – though not everyone is feeling the benefit equally.
Who’s investing to build long-term resilience? And who should?
As short-term resilience improves for many, some households are taking the next step – investing to secure their long-term financial future.
Since the pandemic, the number of investors has blossomed – up 3.7 percentage points. But the trend isn’t evenly spread:
- 63% of the top 20% of earners invest, compared to 23% of the lowest.
- Couples are more likely to invest (48% compared to 32% of singles).
- As couples get older, more of them invest too – at 43% aged 20-40, and 58% for over 50s.
- The same isn’t true for singles, who are less likely to invest at any age.
- Women are also less likely to invest – and the gap is bigger in single households.
Proportion of investors by gender and relationship status
Our Savings and Resilience Barometer considers households are ready to invest if they:
- Have enough emergency savings
- Don’t feel their debts are a burden
- Aren’t in arrears
However, a worrying 28% of households (2.9 million) who don’t meet these criteria are already investing – when they should be focusing on short-term resilience.
Meanwhile, 8.7 million households are in a good position to invest, but 42% of them don’t. Even in the top 20% of earners, 3.2 million households are in a position to invest – yet nearly a third (31%) currently don’t.
Some could need to hold large sums in savings for short-term needs like a property purchase, but others should look at the huge potential investment offers.
Explore our savings and investment accounts
Regional differences
As ever, there were wide variations in financial health across the country.
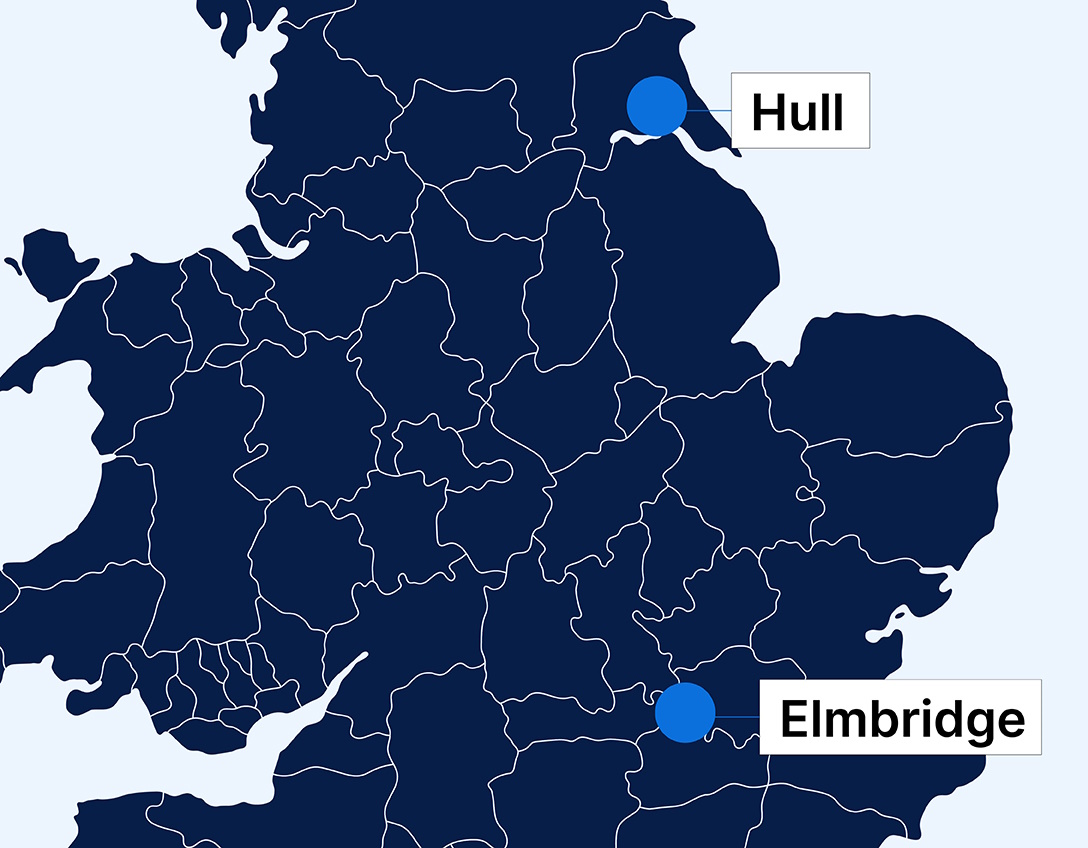
Overall, there’s a yawning 15 percentage point gap between the most resilient local authority – Elmbridge – and the least resilient - Kingston Upon Hull.
The affluent Home Counties account for 8 out of 10 most resilient of the local authorities. Meanwhile, London features 5 of the 10 least resilient.
Some of this comes down to home ownership – only 43% are on track with home ownership in the least resilient local authorities, compared to 71% among the strongest.
Long-term weaknesses
In this issue of the Barometer, we’ve changed how we measure whether people have enough put aside for retirement. Instead of using a single benchmark – the Pension and Lifetime Saving Association’s (PLSA) moderate retirement income level – we’re combining two:
- An adjusted version of the Pension Commission’s Target Replacement Rate (TRR) – which varies based on income but aims for a pension income of two thirds a pre-retirement salary for the average earner.
- A Living Wage Pension benchmark, ensuring lower earners are aiming high enough.
It also reduces the gap between income groups:
- Under the old measure, just 6% of low earners were saving enough, versus 52% of high earners.
- Now, around 40% of both groups are on track, regardless of what they earn.
This reflects how state benefits like the state pension and housing support help lower earners meet their retirement needs.
Combining the two is a better way of measuring whether people can retire without compromising their standard of living.
Using this new approach, 43% of households are on track for an adequate retirement – a modest improvement, though there’s still much to do.
Mind the gap
Despite more households being on track for retirement, regardless of what they earn, the pension gap – measuring how much extra people need to save – does vary.
- For the highest earning 20% of households, it’s £64,800 – because they need so much more in their personal pensions.
- Regional performance varies, with areas having large renter populations – especially cities or urban areas – tending to perform worse. London is notably affected due to many high earners unlikely to replace their pre-retirement incomes and a high renter proportion, who are more likely to fall below the Living Wage floor.
- In the top 10 local authorities, 54% of households meet the benchmark, compared to just 28% in the lowest-ranked local authorities.
More on our award-winning SIPP
Looking beyond pensions for retirement
Pensions are a hugely tax efficient way to save for retirement, but effective planning needs to look at your assets in their entirety. The pie chart shows the percentage of households who have pensions but no investments, those who have investments but no pension and those who have neither.
When investment assets are combined with excess savings (above the level needed for emergencies), the overall picture improves. This is particularly the case for the self-employed, who might not save into pensions but will have other assets to fall back on.
Joining the UK’s number 1 savings and investment platform
The future
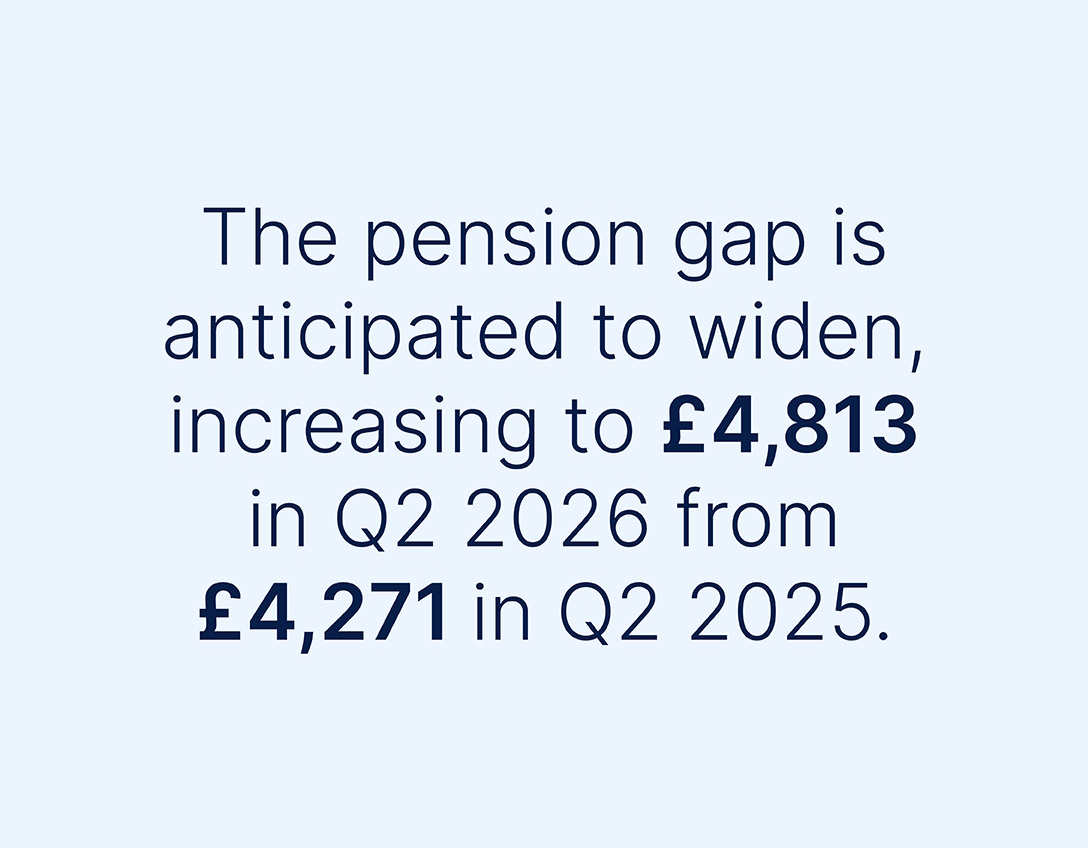
Financial resilience levels are unlikely to change significantly in the next 12 months, although there could be a modest increase in disposable income, which supports slightly more savings. On the flip side, households might be left with marginally less at the end of the month and longer-term resilience could weaken, because house price growth may be sluggish, and the pension gap is expected to widen.
See how resilient your area is
5 key pillars for financial resilience
Invest to make more of your money
Investing offers the potential to make your money work harder for you. That’s why we’ve looked at households who are investing for the long term.
Plan for later life
For most of us, pension savings will be our bread and butter when we stop working. We’ve looked at how to build long-term financial resilience for life after work.
Save a penny for a rainy day
Rainy day savings are a key part of financial resilience. We’ve examined who has enough emergency savings, extra cash, and access to benefits like sick pay and redundancy packages.
Protect you and your family
Protecting your income and ensuring your loved ones are supported if you're unable to contribute is crucial. We've explored how families can financially navigate the loss of a household member or the main breadwinner's income.
Control your debt
It’s essential you manage debt to benefit you in the long run, rather than letting it negatively impact your daily life. We’ve looked at how to manage debts.
Want to know more?
Discover more about the powerful index we've developed in collaboration with Oxford Economics and gain deeper insights into how it measures financial resilience across the nation.
Our full report is packed with valuable information that will help you understand the true picture of financial security today.
Curious about how we've calculated and measured each of the 5 to Thrive pillars? Our methodology document, published by Oxford Economics, dives into the details and explains the research behind our findings.
For a comprehensive view of all our reports and resources, including expert insights and in-depth analyses, explore the full range of documents we've made available.
View all reports and documents
Want to talk?
For further information or any questions, contact us.
Important information – This page is designed as guidance, not personal advice. Learn more about the differences between the two. If you’re still not sure what’s right for you, you should ask for advice. All investments and any income they produce can fall as well as rise in value so you could get back less than you invest, especially over the short term. Past performance is not a guide to the future.