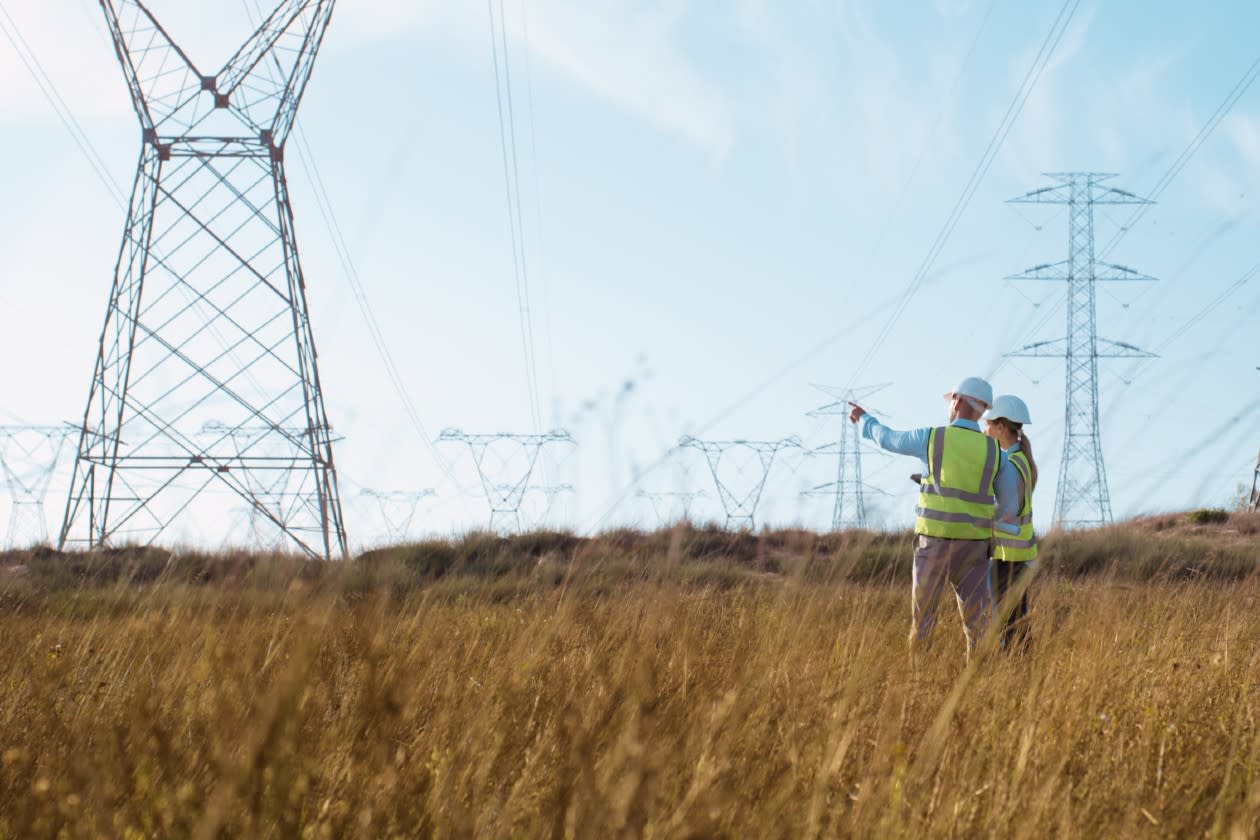
SSE’s first quarter trading update pointed to a strong performance in its Networks division. Underlying investment in Networks has increased too, rising nearly 70% to £0.5bn.
In renewables robust capacity was offset by unfavourable spring weather conditions, resulting in a 4% decline in output.
The group’s financial guidance remains in-tact. However, SSE is yet to provide earnings per share (EPS) guidance for this financial year. Next year’s underlying EPS is expected to land between 175-200 pence compared to 160.9 pence last year.
The shares were flat in early trading.
Our view
Investors haven’t taken fright at SSE’s lack of specific guidance for this year. The market’s expecting a 3% drop in underlying earnings per share and while results are typically second half weighted, management will be hoping the breeze will be blowing harder against its wind turbines over the rest of the year.
SSE is attempting to charge towards a greener future, with increased capacity helping its renewable energy output rise around 18% last year. The shift to renewables is a bold and admirable move. But comes with a hefty dose of risk - they're not always reliable. To some degree, it's at the mercy of mother nature.
That’s why more flexible gas-fired plants are still part of the energy mix. They complement the renewables segment well and are on hand to plug any shortfalls in energy output when adverse weather comes along.
On the regulated networks side of things, SSE delivers electricity across Scotland and Southern England. This is classic utility territory - with revenues predictable and profits closely regulated.
A portion of these regulated revenues are positively related to investment levels, and are also protected against inflation. But the additional return isn't received until sometime after the service has been delivered and the investment has been made, which can cause a drag on cash flows in the meantime.
However, the group’s investment plans have been wound back by £3.0bn to £17.5bn in the five years to March 2027. This pullback is fairly broad-based across its divisions and results from a more challenging macroeconomic backdrop than when the plan was first announced.
It’s a wise move to prevent an overstretched balance sheet. The net debt to EBITDA ratio is expected to head towards 4x in the medium term. That’s not too concerning, but investors will want to see that the capital is generating acceptable returns.
In recent years many areas of SSE's business have benefitted from high prices and volatility. But with market conditions seemingly less turbulent now, profits in the flexible thermal and gas storage division look set to remain subdued this year. Other areas of the business will have to step up to pay the investment bill. Any missteps on this front could dent investor sentiment.
The valuation remains below the long-run average and doesn’t look too demanding to us. We’re optimistic about the group’s long-term prospects. But in the near-to-medium term, SSE faces some uncertainty as it tries to navigate the challenges of building for the future.
Environmental, social and governance (ESG) risk
The utilities industry is high-risk in terms of ESG. Management of these risks tends to be strong, with European firms outperforming their overseas counterparts. Environmental risks like carbon emissions, resource use and non-carbon emissions and spills tend to be the most significant risks for this industry. Employee health and safety and community relations are also key risks to monitor.
According to Sustainalytics, SSE’s management of ESG risk is strong.
It has a board-level committee overseeing ESG issues such as health, safety, and environmental programmes. SSE ceased operating its last coal plant in 2020, and it has a large pipeline of wind projects. However, there is new and existing gas- and oil-based capacity. The regulator has also fined it several times for breaches related to charges imposed on customers.
SSE key facts
All ratios are sourced from LSEG Datastream, based on previous day’s closing values. Please remember yields are variable and not a reliable indicator of future income. Keep in mind key figures shouldn’t be looked at on their own – it’s important to understand the big picture.
This article is not advice or a recommendation to buy, sell or hold any investment.No view is given on the present or future value or price of any investment, and investors should form their own view on any proposed investment.This article has not been prepared in accordance with legal requirements designed to promote the independence of investment research and is considered a marketing communication.Non - independent research is not subject to FCA rules prohibiting dealing ahead of research, however HL has put controls in place(including dealing restrictions, physical and information barriers) to manage potential conflicts of interest presented by such dealing.Please see our full non - independent research disclosure for more information.


