Yields
What is a yield?
A yield measures any income from an investment over a set period of time, such as dividends from shares or interest from bonds.
A yield is an important metric for lots of investors, especially for those looking to secure an income in retirement. They can be a handy tool to forecast the income you could earn from your investments. However, it’s important to remember they are variable and not guaranteed and not a reliable indicator of future income.
How do yields work?
Yields are typically expressed as a percentage, which is calculated based on any income payments (usually over the last 12 months) and the current market value of the investment.
If, for example, a company share paid £5 in dividends per share to shareholders over the last year, with a current market value of £100, the yield would be 5% (income / share price = yield).
What can yields tell investors?
Yields can offer an indication of what you might receive, but they are not reliable. There’s no guarantee that companies will pay the same level of dividends to their shareholders year-on-year. Companies hope that yields will pay more, but they could pay less, or even none at all.
An investment with a high yield isn’t necessarily the best investment choice, either. Companies that are higher risk need to offer a higher potential return to make the investment worthwhile.
A high yield can also signal that a company is in retreat. As yields are calculated based on the investment’s latest market value, a recent share price drop could drive yields higher than their long-term average. This is one reason that investors should look at other areas of an investment’s performance, such as revenue, debt, and cash flow, before making any investment decisions.
Type of yields
Shares
Trailing/historic yield – this represents the amount a company has paid its shareholders for owning a share of the company. It’s calculated by looking at any income the company has paid over the last year and then dividing it by the current share price (dividend/price=yield).
Prospective yield – is an estimate of the future income that might be expected to be paid over the next twelve months, divided by the current share price.
Bonds
Nominal yield – also known as the bond’s coupon rate, this is the rate of interest the bond issuer has agreed to pay in return for borrowing money from an investor. It’s calculated by dividing the annual interest payments by the issue price.
Running yield – this figure measures a bond’s return by looking at the interest that is expected to be paid over the next twelve months divided by the bond’s latest unit price. This is a yield used by investors who might be looking to buy a bond on the secondary market because the market price often deviates from the issue price once it’s trading.
Gross redemption yield – this type of yield allows investors to estimate the average annual return that could be earned from a bond by holding it to the end date – also known as the maturity date. The gross redemption yield includes any capital gain or loss, plus any interest earned.
What is the yield curve?
The yield curve represents the relationship between interest rates and time. All else being equal, in normal circumstances, bonds with longer maturities will have a higher yield than bonds with a shorter maturity because of the risks associated with time.
If you were to plot the yields from different bonds with different maturity dates on a chart, it would create a ‘curve’ – as seen below.
Normal yield curve
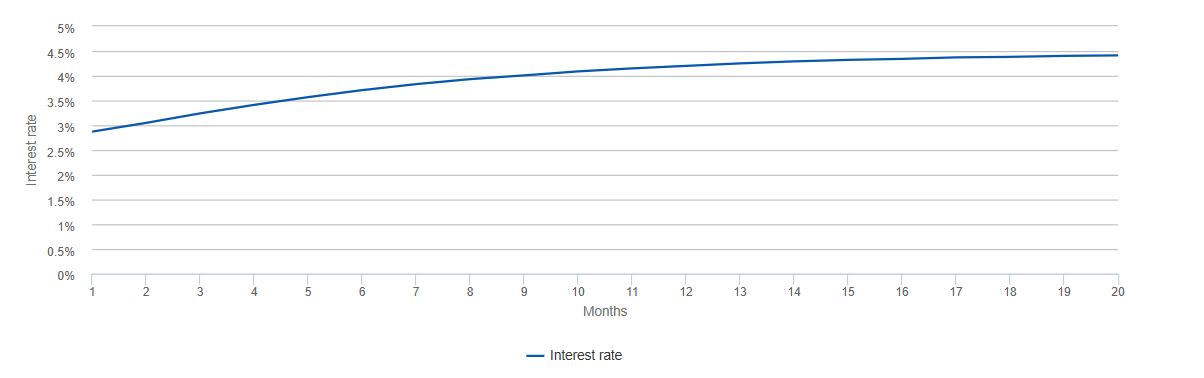
This is where the term ‘yield curve’ comes from. The slope of the curve can give investors an idea of future interest rate changes and economic activity.
Types of yield curves
Normal yield curve
A yield curve is categorised as ‘normal’ when the curve starts with low yields for bonds for shorter maturities and continues to slope upwards with higher yields for bond with longer maturities. A normal yield curve is expected when economic conditions are stable.
Inverted yield curve
An inverted yield curve is the opposite of a normal yield curve. In this scenario, bonds with short-dated bonds yield higher returns than long-dated bonds. This type of yield curve is a warning sign for the economic outlook as they’ve historically been a pretty good predictor that a recession is on the horizon. Of course, history doesn’t always repeat itself.
Flat yield curve
The clue is in the name – it’s flat. It means there’s little difference in yields between bonds with different maturities. As such, a flat yield curve can indicate towards a bleak economic outlook and could also mean a recession isn’t too far away.