News & Insights


Latest podcast


Special Guest Bill Ackman on Markets, AI and Concentrated Investing
In this special episode of Switch Your Money On, Anna Macdonald and Matt Britzman are joined by Bill Ackman, founder and CEO of Pershing Square Capital Management.
Read or listen now
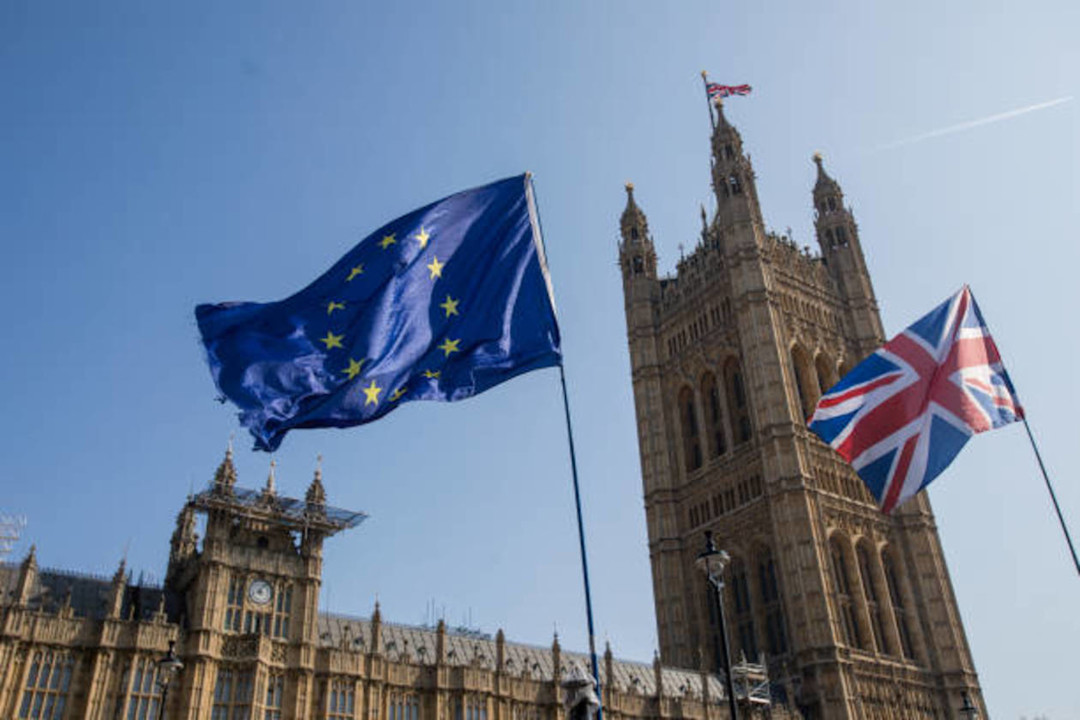
Prime Minister resigns


Politics may change quickly. Your investment strategy should not
Andy Burnham’s seemingly inevitable journey to being Prime Minister has started a new phase in UK politics. For investors, the lesson is less dramatic: stay diversified, stay invested and avoid letting Westminster noise drive your long-term decisions.
Read now
Newletters
Join over 270,000 weekly subscribers


Stock markets today
Prices delayed by at least 15 minutes
Next week on the stock market
22nd June - 26th June 2026
- Could the party be getting started again at Carnival?
- Are conditions improving on the ground for Sunbelt Rentals?
- The demand outlook remains for Babcock.


Our savings and resilience report


Higher earners have the most alarming pension gaps
We’ve partnered with experts at Oxford Economics to explore ways to strengthen household finances, compared which regions are more financially resilient than others, and the potential risks to the nation for 2025.
Explore our research


Newsroom
News from leading news agencies. Hargreaves Lansdown is not responsible for article content and accuracy. We may not share the views of the author.