News & Insights
HL LIVE
Updated Friday 6th February 2026
Live blog covering today's important financial market events and news


Switch Your Money On podcast


HMRC Self-Assessment: Tax return deadlines, penalties and fixes
Sarah Coles and Helen Morrissey explain HMRC self-assessment, including the self-assessment tax return deadline, late filing penalties, common mistakes, what to do after the deadline passes and how to amend a return.
Read or listen now


Stock markets today
Prices delayed by at least 15 minutes
Next week on the stock market
9th-13th February 2026
- AstraZeneca on track to meet 2025 numbers, assurance needed on future targets
- Barratt Redrow hoping to build towards full-year guidance
- Unilever’s sales growth outlook will be in focus following its Ice-Cream demerger


Our savings and resilience report
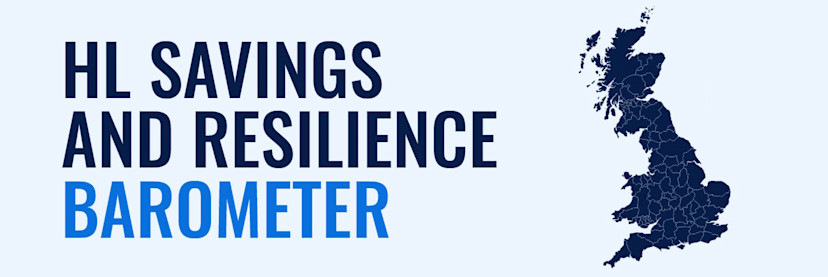
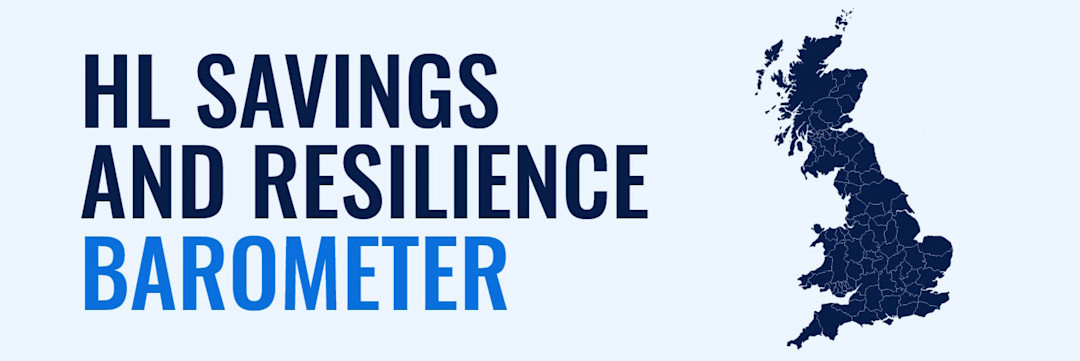
Higher earners have the most alarming pension gaps
We’ve partnered with experts at Oxford Economics to explore ways to strengthen household finances, compared which regions are more financially resilient than others, and the potential risks to the nation for 2025.
Explore our research


Newsroom
News from leading news agencies. Hargreaves Lansdown is not responsible for article content and accuracy. We may not share the views of the author.